
Angular Google 图表 - 基本条形图
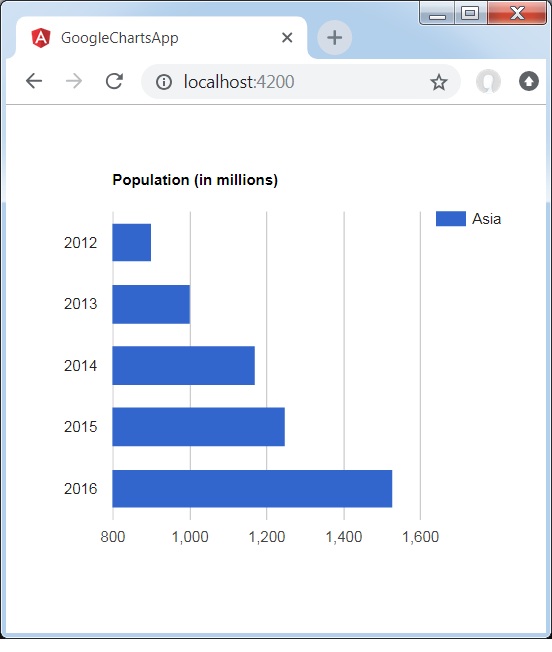
以下是基本条形图的示例。
我们已经在 Google 图表配置语法一章中了解了用于绘制图表的配置。 现在,让我们看一个基本条形图的示例。
配置
我们使用BarChart类来显示基于条形的图表。
type = 'BarChart';
示例
app.component.ts
import { Component } from '@angular/core';
@Component({
   selector: 'app-root',
   templateUrl: './app.component.html',
   styleUrls: ['./app.component.css']
})
export class AppComponent {
   title = 'Population (in millions)';
   type = 'BarChart';
   data = [
      ["2012", 900],
      ["2013", 1000],
      ["2014", 1170],
      ["2015", 1250],
      ["2016", 1530]
   ];
   columnNames = ['Year', 'Asia'];
   options = { };
   width = 550;
   height = 400;
}
结果
验证结果。
❮ angular_googlecharts_bar_charts.html

