
更改 Matplotlib 图的默认背景颜色
matplotlibpythondata visualization更新于 2025/7/10 17:48:17
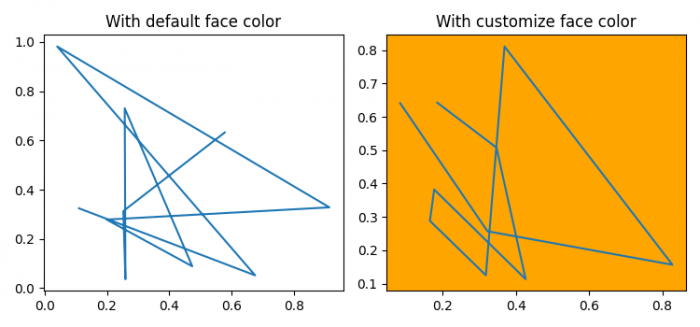
要更改 Matplotlib 图的默认背景颜色,我们可以采取以下步骤 −
步骤
- 设置图形大小并调整子图之间和周围的填充。
- 获取当前轴。
- 向当前图形添加一个子图,其中 nrows=1、ncols=2 和 index=1。
- 使用 plots() 方法绘制随机 x 和 y 数据点。
- 设置子图的标题。
- 向当前图形添加一个子图,其中 nrows=1、ncols=2 和index=2.
- 获取当前轴。
- 设置自定义面颜色。
- 使用 plot() 方法绘制 x 和 y 数据点。
- 设置绘图标题。
- 要显示图形,请使用 show() 方法。
示例
import numpy as np
import matplotlib.pyplot as plt

plt.rcParams["figure.figsize"] = [7.50, 3.50]
plt.rcParams["figure.autolayout"] = True

ax = plt.gca()

print("Default face color is: ", ax.get_facecolor())

plt.subplot(121)
plt.plot(np.random.rand(10), np.random.rand(10))
plt.title("With default face color")
plt.subplot(122)

ax = plt.gca()
ax.set_facecolor("orange")

plt.plot(np.random.rand(10), np.random.rand(10))
plt.title("With customize face color")

plt.show()
输出
相关文章
有用资源
python 参考教程 - 该教程包含有关 python 的更多信息:https://www.cainiaomax.com/python/

