如何将 Matplotlib 图的输出作为 SVG?
matplotlibsvgserver side programmingprogramming更新于 2025/5/10 13:07:17
只需使用 pyplot 包的 savefig 方法并提及文件格式,我们就可以将输出保存为 SVG 格式。
步骤
使用 subplots 方法创建 fig 和 ax 变量,其中默认 nrows 和 ncols 为 1。
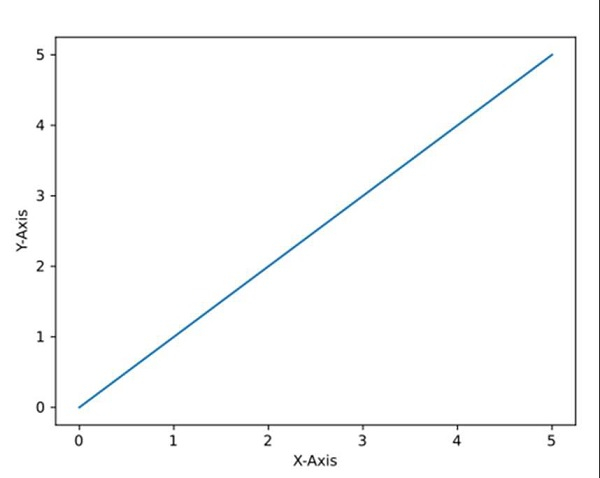
使用 np.array(0, 5) 创建 xpoints 和 ypoints。
使用 xpoints 和 ypoints 绘制线条。
使用 plt.xlabel() 方法设置 X 轴标签。
使用 plt.ylabel() 方法设置 Y 轴标签。
要以 SVG 格式保存文件,使用 savefig() 方法,其中图像名称为 myImagePDF.svg,格式为"svg"。
要显示图像,请使用 plt.show() 方法。
示例
import matplotlib.pyplot as plt
import numpy as np

fig, ax = plt.subplots()
xpoints = np.array([0, 5])
ypoints = np.array([0, 5])
plt.plot(xpoints, ypoints)

plt.ylabel("Y-axis ")
plt.xlabel("X-axis ")

image_format = 'svg' # e.g .png, .svg, etc.
image_name = 'myimage.svg'

fig.savefig(image_name, format=image_format, dpi=1200)
输出