
如何使用 Tensorflow 与估算器来可视化泰坦尼克号数据?
tensorflowserver side programmingprogramming更新于 2025/5/21 10:37:17
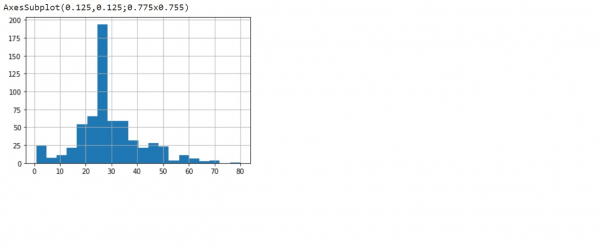
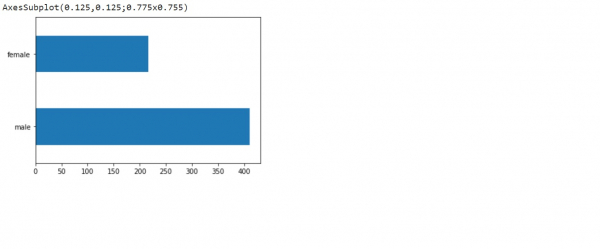
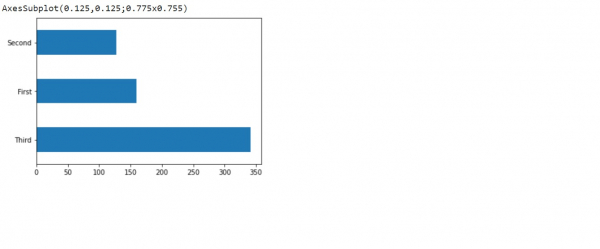
可以使用‘hist’方法可视化泰坦尼克号数据集,该方法可以可视化直方图。通过将图形类型指定为‘barh’,可以生成水平条形图。
阅读更多: 什么是 TensorFlow,以及 Keras 如何与 TensorFlow 配合使用来创建神经网络?
我们将使用 Keras Sequential API,它有助于构建用于处理普通层堆栈的顺序模型,其中每个层都有一个输入张量和一个输出张量。
TensorFlow Text 包含可与 TensorFlow 2.0 一起使用的文本相关类和操作的集合。 TensorFlow Text 可用于预处理序列建模。
我们使用 Google Colaboratory 运行以下代码。Google Colab 或 Colaboratory 有助于在浏览器上运行 Python 代码,无需配置,可免费访问 GPU(图形处理单元)。Colaboratory 建立在 Jupyter Notebook 之上。
Estimator 是 TensorFlow 对完整模型的高级表示。它旨在轻松扩展和异步训练。我们将使用 tf.estimator API 训练逻辑回归模型。该模型用作其他算法的基线。我们使用泰坦尼克号数据集,目的是根据性别、年龄、舱位等特征预测乘客生存情况。
示例
print("Visualizing the data")
print(dftrain.age.hist(bins=20))
print(dftrain.sex.value_counts().plot(kind='barh'))
print(dftrain['class'].value_counts().plot(kind='barh'))
pd.concat([dftrain, y_train], axis=1).groupby('sex').survived.mean().plot(kind='barh').set_xlabel('% survive')
代码来源 −https://www.tensorflow.org/tutorials/estimator/linear
输出
Visualizing the data
解释
- 对泰坦尼克号数据集的各个特征列进行了可视化。
- 使用‘plot’方法绘制它们。

