
如何在 Tkinter 中运行 Matplotlib?
tkinterpythongui-programming更新于 2025/6/18 7:40:17
Python Matplotlib 库在许多应用程序中都很有用,可用于以图形和图表的形式可视化给定的数据和信息。可以在 Tkinter 应用程序中运行 matplotlib。通常,在应用程序中明确导入任何 Python 库都可以访问库中的所有函数和模块。
要创建使用 matplotlib 及其函数的 GUI 应用程序,我们必须使用命令 from matplotlib.pyplot as plt 导入库。但是,我们还在以交互方式使用 Tkinter 用户界面的后端中使用 Tkagg。
示例
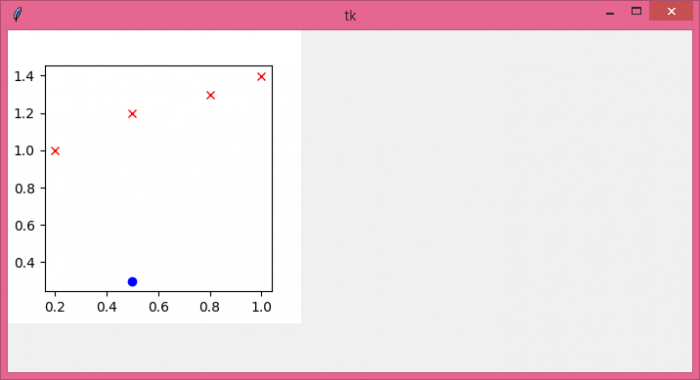
在此示例中,我们导入了 Tkagg 和 matplotlib,通过在画布小部件内绘制给定的数据点来可视化它们。
# 导入所需的库
from tkinter import *
from tkinter import ttk
import matplotlib
from matplotlib.figure import Figure
from matplotlib.backends.backend_tkagg import FigureCanvasTkAgg

# 创建 tkinter 框架的实例
win= Tk()

# 设置窗口大小
win.geometry("700x350")

# 使用 TkAgg
matplotlib.use("TkAgg")

# 创建特定图形大小
figure = Figure(figsize=(3, 3), dpi=100)

# 定义绘制图形的点
plot = figure.add_subplot(1, 1, 1)
plot.plot(0.5, 0.3, color="blue", marker="o", linestyle="")

# 定义 x 和 y 轴的数据点
x = [0.2,0.5,0.8,1.0 ]
y = [ 1.0, 1.2, 1.3,1.4]
plot.plot(x, y, color="red", marker="x", linestyle="")

# 添加画布小部件以将图形与画布关联
canvas = FigureCanvasTkAgg(figure, win)
canvas.get_tk_widget().grid(row=0, column=0)

win.mainloop()
输出
当我们运行上面的代码时,窗口中会出现一个图,其中 X 轴和 Y 轴上有一些数据点。
相关文章
有用资源
python 参考教程 - 该教程包含有关 python 的更多信息:https://www.cainiaomax.com/python/

