
使用 LaTeX 渲染时,如何更改 Matplotlib 图中的轴刻度字体?
matplotlibpythondata visualization更新于 2025/4/22 9:48:17
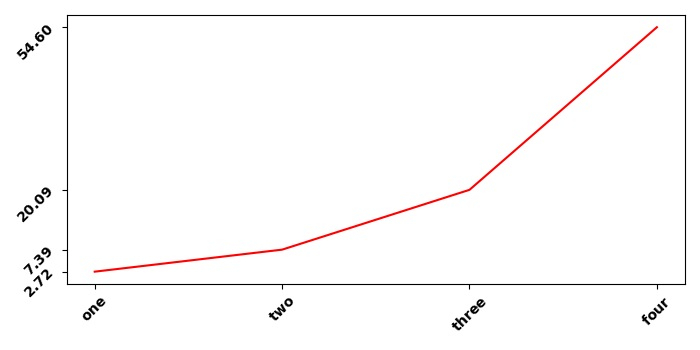
要使用 LaTeX 渲染时,更改 matplotlib 中的轴刻度字体,我们可以采取以下步骤 −
使用 numpy 创建 x 和 y 数据点。
使用 subplot() 方法,向当前图形添加子图。
分别使用 set_xticks 和 set_yticks 方法使用数据点 x 和 y 设置 x 和 y 刻度。
使用 plot() 方法绘制 x 和 y,其中 color=red。
要设置粗体字体粗细,我们可以使用 LaTeX表示。
要显示图形,请使用 show() 方法。
示例
import numpy as np
import matplotlib.pyplot as plt
plt.rcParams["figure.figsize"] = [7.00, 3.50]
plt.rcParams["figure.autolayout"] = True
x = np.array([1, 2, 3, 4])
y = np.exp(x)

ax1 = plt.subplot()
ax1.set_xticks(x)
ax1.set_yticks(y)
ax1.plot(x, y, c="red")
ax1.set_xticklabels(["$\bf{one}$", "$\bf{two}$", "$\bf{three}$", "$\bf{four}$"], rotation=45)
ax1.set_yticklabels(["$\bf{:.2f}$".format(y[0]), "$\bf{:.2f}$".format(y[1]),
   "$\bf{:.2f}$".format(y[2]), "$\bf{:.2f}$".format(y[3])], rotation=45)
plt.tight_layout()
plt.show()
输出
相关文章
有用资源
python 参考教程 - 该教程包含有关 python 的更多信息:https://www.cainiaomax.com/python/

