
如何使用 Matplotlib 中的 networkx 自定义边标签的显示?
matplotlibpythondata visualization更新于 2025/7/5 20:28:17
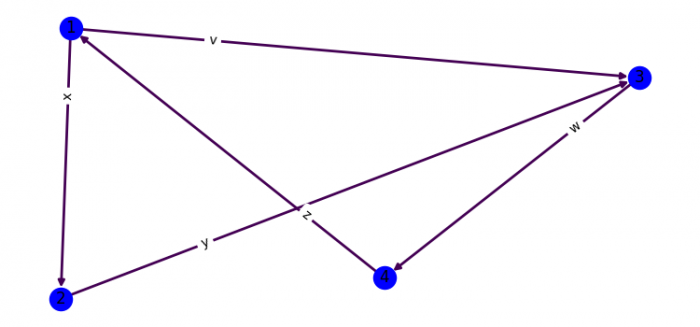
要设置 networkx 边标签偏移,我们可以采取以下步骤 −
- 设置图形大小并调整子图之间和周围的填充。
- 使用边、名称或图形属性初始化图形。
- 添加多个节点。
- 使用 Fruchterman-Reingold 力导向算法定位节点。
- 使用 Matplotlib 绘制图形 G。
- 绘制边标签。
- 要显示图形,请使用 show() 方法。
示例
import matplotlib.pylab as plt
import networkx as nx

plt.rcParams["figure.figsize"] = [7.50, 3.50]
plt.rcParams["figure.autolayout"] = True

G = nx.DiGraph()
G.add_nodes_from([1, 2, 3, 4])
G.add_edges_from([(1, 2), (2, 3), (3, 4), (4, 1), (1, 3)])

pos = nx.spring_layout(G)

for u, v, d in G.edges(data=True):
d['weight'] = 3

edges, weights = zip(*nx.get_edge_attributes(G, 'weight').items())

nx.draw(G, pos, node_color='b', edge_color=weights,
width=2, with_labels=True)

nx.draw_networkx_edge_labels(G, pos,
                              {
                                 (1, 2): "x", (2, 3): "y", (3, 4): "w",
                                 (4, 1): "z", (1, 3): "v"
                              },
                              label_pos=0.75
                              )
plt.show()
输出
相关文章
有用资源
python 参考教程 - 该教程包含有关 python 的更多信息:https://www.cainiaomax.com/python/

