
如何在 matplotlib 中放置带注释的圆圈?
matplotlibpythondata visualization更新于 2025/11/3 6:04:17
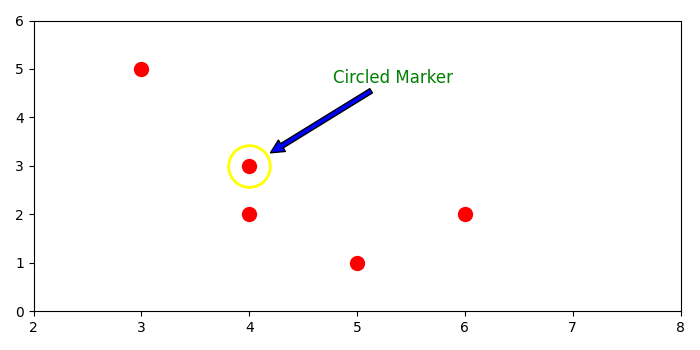
要在 matplotlib 中放置带注释的圆圈,我们可以采取以下步骤 −
- 设置图形大小并调整子图之间和周围的填充。
- 使用 numpy 创建数据点。
- 获取点坐标以放置带注释的圆圈。
- 获取当前轴。
- 使用 plot() 方法绘制数据和数据点。
- 设置 X 和 Y 轴比例。
- 要放置带圆圈的标记,请使用 plot() 方法,其中 marker='o' 和一些属性。
- 用箭头样式注释该圆圈(步骤 7)。
- 要显示图形,请使用 show() 方法。
示例
import matplotlib.pyplot as plt
import numpy as np

plt.rcParams["figure.figsize"] = [7.00, 3.50]
plt.rcParams["figure.autolayout"] = True

data = np.array([[5, 3, 4, 4, 6],
   [1, 5, 3, 2, 2]])
point = data[:, 2]
ax = plt.gca()
ax.plot(data[0], data[1], 'o', ms=10, color='red')

ax.set_xlim([2, 8])
ax.set_ylim([0, 6])
radius = 15

ax.plot(point[0], point[1], 'o',
   ms=radius * 2, mec='yellow', mfc='none', mew=2)

ax.annotate('Circled Marker', xy=point, xytext=(60, 60),
   textcoords='offset points',
   color='green', size='large',
   arrowprops=dict(
      arrowstyle='simple,tail_width=0.3,head_width=0.8,head_length=0.8',
      facecolor='b', shrinkB=radius * 1.2)
   )

plt.show()
输出
它将产生以下输出

相关文章
有用资源
python 参考教程 - 该教程包含有关 python 的更多信息:https://www.cainiaomax.com/python/

