
如何在 Matplotlib 中向曲线添加光标?
matplotlibpythondata visualization更新于 2025/9/12 8:12:17
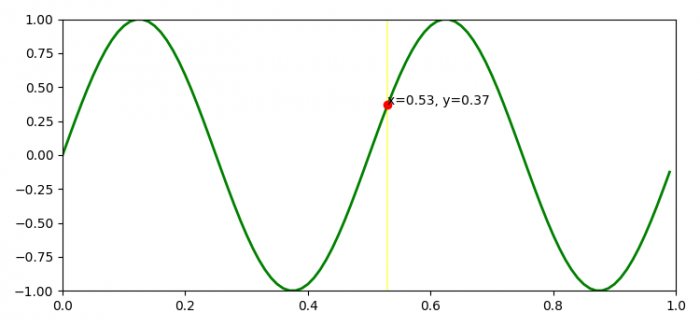
要在 Matplotlib 中向曲线添加光标,我们可以采取以下步骤 −
- 设置图形大小并调整子图之间和周围的填充。
- 使用 numpy 创建 t 和 s 数据点。
- 创建一个图形和一组子图。
- 获取光标类实例,以更新图上的光标点。
- 在 mouse_event 中,获取鼠标当前位置的 x 和 y 数据。
- 获取 x 和 y 数据点'索引。
- 设置 x 和 y 位置。
- 设置文本位置并重新绘制聚合缓冲区和鼠标事件。
- 使用 plot() 方法绘制 t 和 s 数据点。
- 设置一些轴属性。
- 要显示图形,请使用 show() 方法。
示例
import matplotlib.pyplot as plt
import numpy as np

plt.rcParams["figure.figsize"] = [7.50, 3.50]
plt.rcParams["figure.autolayout"] = True

class CursorClass(object):
    def __init__(self, ax, x, y):
        self.ax = ax
        self.ly = ax.axvline(color='yellow', alpha=0.5)
        self.marker, = ax.plot([0], [0], marker="o", color="red", zorder=3)
        self.x = x
        self.y = y
        self.txt = ax.text(0.7, 0.9, '')

def mouse_event(self, event):
    if event.inaxes:
        x, y = event.xdata, event.ydata
        indx = np.searchsorted(self.x, [x])[0]
        x = self.x[indx]
        y = self.y[indx]
        self.ly.set_xdata(x)
        self.marker.set_data([x], [y])
        self.txt.set_text('x=%1.2f, y=%1.2f' % (x, y))
        self.txt.set_position((x, y))
        self.ax.figure.canvas.draw_idle()
     else:
        return

t = np.arange(0.0, 1.0, 0.01)
s = np.sin(2 * 2 * np.pi * t)

fig, ax = plt.subplots()

cursor = CursorClass(ax, t, s)
cid = plt.connect('motion_notify_event', cursor.mouse_event)

ax.plot(t, s, lw=2, color='green')
plt.axis([0, 1, -1, 1])

plt.show()
输出

相关文章
有用资源
python 参考教程 - 该教程包含有关 python 的更多信息:https://www.cainiaomax.com/python/

