
如何使用 Matplotlib 更改 Jupyter 笔记本中 matshow() 的 figsize?
matplotlibpythondata visualization更新于 2025/4/22 1:48:17
要更改 mathshow 的 figsize,我们可以在 figure 方法参数中使用 figsize,并在 matshow() 方法中使用 fignum。
步骤
- 使用 figure() 方法创建新图形或激活现有图形。
- 使用 Pandas 创建数据框。
- 使用 matshow() 方法在新图形窗口中将数组显示为矩阵。
- 参数 fignum 可以取 None、int 或 False 值
- 如果为 *None*,则创建一个具有自动编号的新图形窗口。
- 如果为非零整数,则使用给定的数字绘制到图形中。如果不存在,则创建一个。
- 如果为 0,则使用当前轴(如果不存在,则创建一个)。
- 要显示图形,请使用 show() 方法。
示例
import pandas as pd
from matplotlib import pyplot as plt
plt.rcParams["figure.figsize"] = [7.00, 3.50]
plt.rcParams["figure.autolayout"] = True
plt.figure()
df = pd.DataFrame({"col1": [1, 3, 5, 7, 1], "col2": [1, 5, 7, 9, 1]})
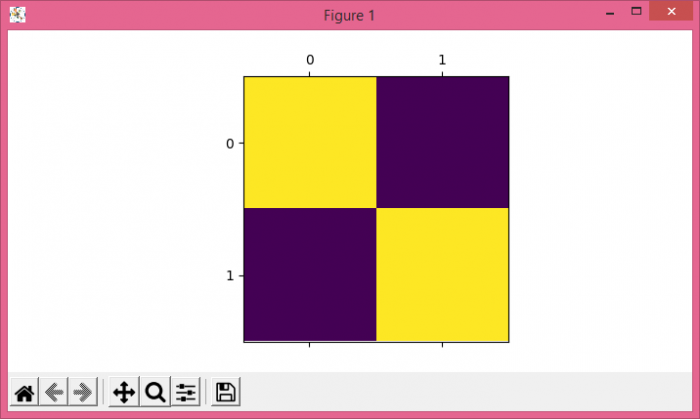
plt.matshow(df.corr(), fignum=1)
plt.show()
输出
相关文章
有用资源
python 参考教程 - 该教程包含有关 python 的更多信息:https://www.cainiaomax.com/python/
打印
下一节:在 Python Matplotlib 中使用 NaN 对图像进行高斯滤波 ❯❮ 上一节:如何更改 matplotlib.pyplot.colorbar.ColorbarBase 的刻度字体大小?

