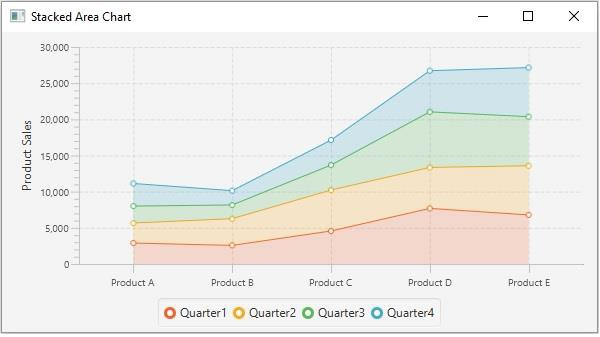
如何使用 JavaFX 创建堆叠面积图?
javafxobject oriented programmingprogramming更新于 2026/1/8 8:12:17
面积图接受一系列数据点 (x, y) 作为输入值,使用线连接它们,并映射获得的线和轴之间的面积。
堆叠面积图是面积图的一种变体,其中区域堆叠在一起,以便每个系列相邻,但不与前面的系列重叠。
在 JavaFX 中,您可以通过实例化 javafx.scene.chart.StackedAreaChart 类来创建堆叠面积图。
在实例化此类时,您必须传递表示 x 和 y 轴的 Axis 类的两个对象(作为构造函数的参数)。由于 Axis 类是抽象的,因此您需要传递其具体子类的对象,NumberAxis(用于数值)或 CategoryAxis(字符串值)。
创建轴后,您可以使用 setLabel() 方法为其设置标签。
设置数据
XYChart.Series 表示一系列数据项。您可以通过实例化此类为线条创建一系列点。此类包含一个可观察列表,其中包含系列中的所有点。
XYChart.Data 表示 x-y 平面中的特定数据点。要创建一个点,您需要通过传递特定点的 x 和 y 值来实例化此类。
示例
import javafx.application.Application;
import javafx.scene.Scene;
import javafx.scene.chart.CategoryAxis;
import javafx.stage.Stage;
import javafx.scene.chart.NumberAxis;
import javafx.scene.chart.StackedAreaChart;
import javafx.scene.chart.XYChart;
import javafx.scene.layout.StackPane;
public class StackedAreaChartExample extends Application {
   public void start(Stage stage) {
      //定义轴
      CategoryAxis xAxis = new CategoryAxis();
      NumberAxis yAxis = new NumberAxis(0, 30000, 5000);
      yAxis.setLabel("Product Sales");
      //创建面积图
      StackedAreaChart<String, Number> areaChart = new StackedAreaChart(xAxis, yAxis);
      //通过设置数据准备XYChart.Series对象
      XYChart.Series series1 = new XYChart.Series();
      series1.setName("Quarter1");
      series1.getData().add(new XYChart.Data("Product A", 2898));
      series1.getData().add(new XYChart.Data("Product B", 2577));
      series1.getData().add(new XYChart.Data("Product C", 4566));
      series1.getData().add(new XYChart.Data("Product D", 7689));
      series1.getData().add(new XYChart.Data("Product E", 6788));
      XYChart.Series series2 = new XYChart.Series();
      series2.setName("Quarter2");
      series2.getData().add(new XYChart.Data("Product A", 2768));
      series2.getData().add(new XYChart.Data("Product B", 3687));
      series2.getData().add(new XYChart.Data("Product C", 5656));
      series2.getData().add(new XYChart.Data("Product D", 5658));
      series2.getData().add(new XYChart.Data("Product E", 6790));
      XYChart.Series series3 = new XYChart.Series();
      series3.setName("Quarter3");
      series3.getData().add(new XYChart.Data("Product A", 2342));
      series3.getData().add(new XYChart.Data("Product B", 1898));
      series3.getData().add(new XYChart.Data("Product C", 3455));
      series3.getData().add(new XYChart.Data("Product D", 7689));
      series3.getData().add(new XYChart.Data("Product E", 6788));
      XYChart.Series series4 = new XYChart.Series();
      series4.setName("Quarter4");
      series4.getData().add(new XYChart.Data("Product A", 3123));
      series4.getData().add(new XYChart.Data("Product B", 1978));
      series4.getData().add(new XYChart.Data("Product C", 3454));
      series4.getData().add(new XYChart.Data("Product D", 5686));
      series4.getData().add(new XYChart.Data("Product E", 6790));
      areaChart.getData().addAll(series1, series2, series3, series4);
      //创建 Group 对象
      StackPane pane = new StackPane(areaChart);
      //设置场景
      Scene scene = new Scene(pane, 595, 300);
      stage.setTitle("Stacked Area Chart");
      stage.setScene(scene);
      stage.show();
   }
   public static void main(String args[]){
      launch(args);
   }
}
输出