
如何获取 Matplotlib 生成的散点图的像素坐标?
matplotlibpythondata visualization更新于 2025/11/10 8:44:17
要获取 matplotlib 生成的散点图的像素坐标,我们可以采取以下步骤 −
- 设置图形大小并调整子图之间和周围的填充。
- 初始化变量"n"保存样本数据的数量。
- 创建一个图形和一组子图。
- 制作散点图。
- 使用 get_data() 方法获取 x 和 y 数据点。
- 获取图的像素值。
- 获取像素转换数据。
- 以点或像素为单位获取图形宽度和高度
- 打印 x 和 y 像素值。
- 要显示图形,请使用 show() 方法。
示例
import numpy as np
import matplotlib.pyplot as plt

plt.rcParams["figure.figsize"] = [7.00, 3.50]
plt.rcParams["figure.autolayout"] = True

n = 10
fig, ax = plt.subplots()

points, = ax.plot(np.random.random(n), np.random.random(n), 'r*')
x, y = points.get_data()

pixels = ax.transData.transform(np.vstack([x, y]).T)
x, y = pixels.T

width, height = fig.canvas.get_width_height()
y = height - y

print("像素坐标为:")
for xp, yp in zip(x, y):
    print('{x:0.2f}\t{y:0.2f}'.format(x=xp, y=yp))

plt.show()
输出
它将会生成以下输出

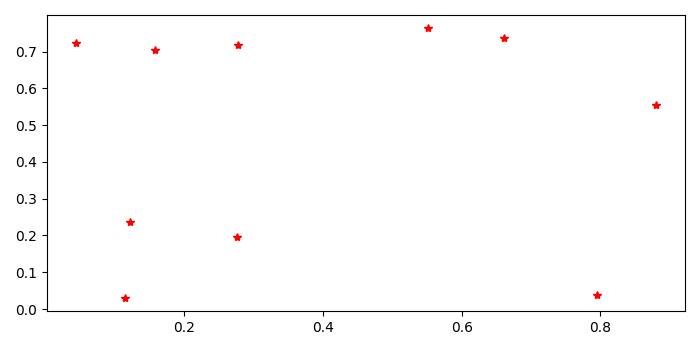
它还会在控制台上打印 matplotlib 生成的散点图的像素坐标
像素坐标为:
564.93   161.83
446.27   112.60
153.39   247.65
236.90   258.34
519.10   301.04
237.66   118.16
149.71   303.29
386.74   105.81
172.93   121.81
110.94   116.20
相关文章
有用资源
python 参考教程 - 该教程包含有关 python 的更多信息:https://www.cainiaomax.com/python/

