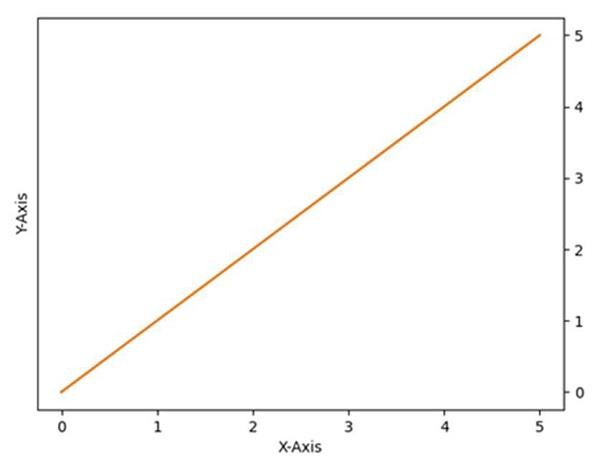
如何在 matplotlib 中将 Y 轴刻度从绘图左侧移到右侧?
matplotlibserver side programmingprogrammingmachine learning更新于 2025/5/13 1:37:17
要将 Y 轴刻度从左向右移动,我们可以执行以下步骤 −
使用 figure() 方法创建一个图形。
使用上面的 figure 方法,使用 add_subplot(xyz) 创建绘图的轴,其中 x 表示行,y 表示列,z 表示索引。
要将 Y 轴刻度从左向右移动,请使用 ax.yaxis.tick_right(),其中 ax 是使用 add_subplot(xyz) 方法创建的轴。
现在使用 plot() 方法绘制线条,给定 x 和 y 点,其中 x 和 y 点可以使用 np.array() 创建方法。
使用 xlabel 和 ylabel 方法设置 x 和 y 标签,例如 X 轴和 Y 轴。
使用 plt.show() 显示图形。
示例
from matplotlib import pyplot as plt
import numpy as np

f = plt.figure()
ax = f.add_subplot(111)
ax.yaxis.tick_right()
xpoints = np.array([0, 5])
ypoints = np.array([0, 5])
plt.plot(xpoints, ypoints)

plt.ylabel("Y-axis ")
plt.xlabel("X-axis ")

plt.show()
输出