
如何使用 Matplotlib 在图上放置自定义图例符号?
matplotlibpythondata visualization更新于 2025/6/8 17:48:17
要在图上绘制自定义图例符号,我们可以采取以下步骤 −
- 设置图形大小并调整子图之间和周围的填充。
- 继承 HandlerPatch 类,覆盖创建艺术家方法,向图中添加椭圆形补丁,并返回补丁处理程序。
- 使用 Circle 类在图上绘制一个圆圈。
- 在当前轴上添加一个圆形补丁。
- 使用 legend() 方法将图例放置在图上。
- 要显示图形,请使用 show() 方法。
示例
import matplotlib.pyplot as plt, matplotlib.patches as mpatches
from matplotlib.legend_handler import HandlerPatch

plt.rcParams["figure.figsize"] = [7.50, 3.50]
plt.rcParams["figure.autolayout"] = True

class HandlerEllipse(HandlerPatch):
   def create_artists(self, legend, orig_handle, xdescent, ydescent, width, height, fontsize, trans):
      center = 0.5 * width - 0.5 * xdescent, 0.5 * height - 0.5 * ydescent
      p = mpatches.Ellipse(xy=center, width=width + xdescent, height=height + ydescent)
      self.update_prop(p, orig_handle, legend)
      p.set_transform(trans)
      return [p]

c = mpatches.Circle((0.5, 0.5), 0.25, facecolor="green", edgecolor="red", linewidth=1)
plt.gca().add_patch(c)

plt.legend([c], ["An ellipse,Customized legend element"],
handler_map={mpatches.Circle: HandlerEllipse()})

plt.show()
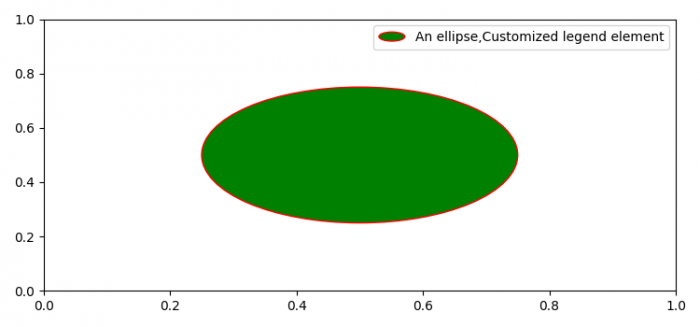
输出
相关文章
有用资源
python 参考教程 - 该教程包含有关 python 的更多信息:https://www.cainiaomax.com/python/

