
如何在 Matplotlib 中用绝对值替换自动标记的相对值?
matplotlibpythondata visualization更新于 2025/7/6 0:12:17
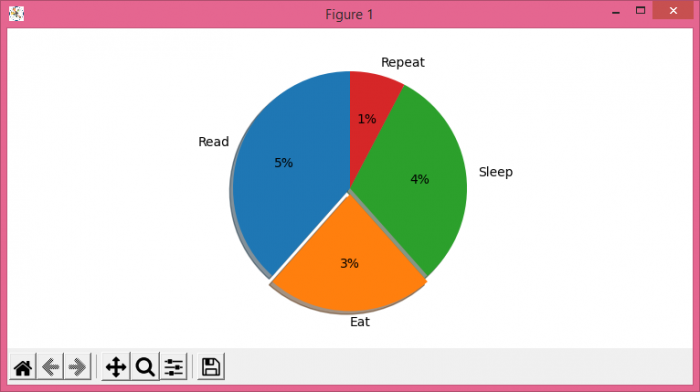
要在 matplotlib 中用绝对值替换自动标记的相对值,我们可以使用 autopct=lambda p: <calculation for result>。
步骤
- 设置图形大小并调整子图之间和周围的填充。
- 制作 标签、分数、爆炸 位置的列表并获取分数的总和以计算百分比。
- 使用 labels、fracs 和 explode 制作饼图,其中 autopct=lambda p: <calculation for percentage>。
- 要显示图形,请使用 show()方法。
示例
import matplotlib.pyplot as plt

plt.rcParams["figure.figsize"] = [7.50, 3.50]
plt.rcParams["figure.autolayout"] = True

labels = ('Read', 'Eat', 'Sleep', 'Repeat')
fracs = [5, 3, 4, 1]
total = sum(fracs)
explode = (0, 0.05, 0, 0)

plt.pie(fracs, explode=explode, labels=labels,
         autopct=lambda p: '{:.0f}%'.format(p * total / 100),
         shadow=True, startangle=90)

plt.show()
输出
相关文章
有用资源
python 参考教程 - 该教程包含有关 python 的更多信息:https://www.cainiaomax.com/python/

