
如何在 Seaborn / Matplotlib 中重新显示因子图 Y 轴的科学计数法?
matplotlibpythondata visualization更新于 2025/6/8 6:04:17
要在 Seaborn/Matplotlib 中重新显示因子图 Y 轴的科学计数法,我们可以在 ticklabel_format() 方法中使用 style="plain"。
步骤
设置图形大小并调整子图之间和周围的填充。
使用键 col1 和 col2 创建一个数据框。
factorplot() 已重命名为 catplot()。
要重新显示科学计数法,请使用 style="plain"在 ticklabel_format() 方法中。
要显示图形,请使用 show() 方法。
示例
from matplotlib import pyplot as plt
import pandas as pd
import seaborn as sns

plt.rcParams["figure.figsize"] = [7.50, 3.50]
plt.rcParams["figure.autolayout"] = True

df = pd.DataFrame({"col1": [1, 3, 5, 7, 1], "col2": [1, 5, 7, 9, 1]})

sns.catplot(y="col1", x="col2", kind='bar', data=df, label="Total", height=3.5)

plt.ticklabel_format(style='plain', axis='y')

plt.show()
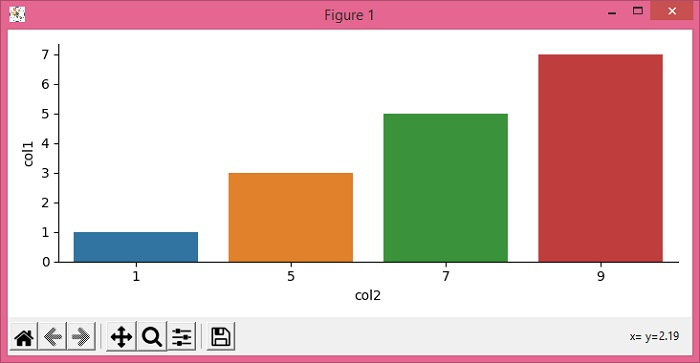
输出
相关文章
有用资源
python 参考教程 - 该教程包含有关 python 的更多信息:https://www.cainiaomax.com/python/

