如何将绘图保存为 RGB 格式的 NumPy 数组?
matplotlibserver side programmingprogrammingnumpy更新于 2025/7/5 21:07:17
要将绘图保存为 RGB 格式的 NumPy 数组,我们可以执行以下步骤 −
使用 NumPy 创建 r、g 和 b 随机数组。
压缩 r、g 和 b(从步骤 1 开始)以生成 rgb 元组列表。
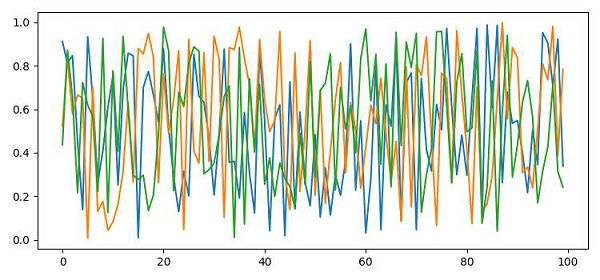
将 rgb 转换为 NumPy 数组并进行绘图。
绘制 NumPy 数组rgb 格式。
将图形保存在当前位置。
要显示图形,请使用 show() 方法。
示例
import numpy as np
from matplotlib import pyplot as plt
plt.rcParams["figure.figsize"] = [7.50, 3.50]
plt.rcParams["figure.autolayout"] = True
r = np.random.rand(100)
g = np.random.rand(100)
b = np.random.rand(100)
rgb = zip(r, g, b)
arr = np.array([item for item in rgb])
plt.plot(arr)
plt.savefig("myplot.png")
plt.show()
输出