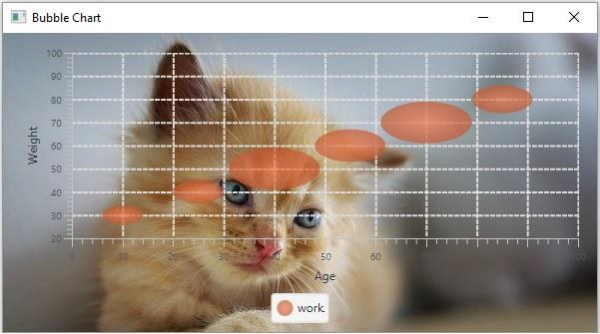
如何为 JavaFX 图表设置背景图片?
javafxobject oriented programmingprogramming更新于 2026/1/8 2:52:17
javafx.scene.chart 包提供了用于创建各种图表的类,即 −折线图、面积图、条形图、饼图、气泡图、散点图等。
您可以通过实例化相应的类来创建所需的图表。
设置背景图像和颜色
JavaFX CSS 中的 -fx-background-image 类用于将图像设置为图表的背景。
JavaFX CSS 中的 -fx-background-color 类(属于区域 chart-plot-background)用于设置背景颜色。
JavaFX Scene 类有一个可观察列表,用于保存所有必需的样式表。您可以使用 getStylesheets() 方法获取此列表。
将图像设置为图表的背景 −
在项目工作表的当前包中创建一个 CSS 文件(例如 LineChart.css)。
使用 -fx-background-image CSS 类将背景图像设置为 −
.chart-plot-background {
   -fx-background-image: url("cat.jpg");
}
使用 -fx-background-color CSS 类将绘图颜色设置为透明,并添加 −
.chart-plot-background {
   -fx-background-color: transparent;
}
在程序中,使用 getStylesheets() 方法获取可观察的样式表列表。
使用 add() 方法将创建的 CSS 文件添加到列表中。
示例
LineChart.CSS −
.chart {
   -fx-padding: 10px;
   -fx-background-image: url("cat.jpg");
}
.chart-plot-background {
   -fx-background-color: transparent;
}
.chart-vertical-grid-lines {
   -fx-stroke: #dedddc; -fx-stroke-width: 2;
}
.chart-horizontal-grid-lines {
   -fx-stroke: #dedddc; -fx-stroke-width: 2;
}
Example.java −
import javafx.application.Application;
import javafx.scene.Scene;
import javafx.scene.chart.BubbleChart;
import javafx.stage.Stage;
import javafx.scene.chart.NumberAxis;
import javafx.scene.chart.XYChart;
import javafx.scene.layout.StackPane;
public class Example extends Application {
   public void start(Stage stage) {
      //定义坐标轴
      NumberAxis xAxis = new NumberAxis(0, 100, 10);
      xAxis.setLabel("Age");
      NumberAxis yAxis = new NumberAxis(20, 100, 10);
      yAxis.setLabel("Weight");
      //创建气泡图
      BubbleChart bubbleChart = new BubbleChart(xAxis, yAxis);
      //通过设置数据准备 XYChart.Series 对象
      XYChart.Series series = new XYChart.Series();
      series.setName("work");
      series.getData().add(new XYChart.Data(10,30,4));
      series.getData().add(new XYChart.Data(25,40,5));
      series.getData().add(new XYChart.Data(40,50,9));
      series.getData().add(new XYChart.Data(55,60,7));
      series.getData().add(new XYChart.Data(70,70,9));
      series.getData().add(new XYChart.Data(85,80,6));
      //将数据设置为条形图
      bubbleChart.getData().add(series);
      //创建一个 Group 对象
      StackPane root = new StackPane(bubbleChart);
      //设置场景
      Scene scene = new Scene(root, 595, 300);
      stage.setTitle("Bubble Chart");
      scene.getStylesheets().add("styles/LineChart.css");
      stage.setScene(scene);
      stage.show();
   }
   public static void main(String args[]){
      launch(args);
   }
}
输出