
如何查看 Matplotlib 中可用的所有颜色图?
matplotlibpythondata visualization更新于 2025/7/3 3:24:17
要查看 Matplotlib 中可用的所有颜色图,我们可以采取以下步骤 −
- 设置图形大小并调整子图之间和周围的填充。
- 创建一个新图形或激活现有图形。
- 将 '~.axes.Axes' 添加到图形作为子图排列的一部分
- 创建一个在现有轴上分隔的轴。
- 使用 numpy 创建随机数据。
- 将数据显示为图像,即在 2D 常规栅格上。
- 为 ScalarMappable 实例 im 创建颜色条。
- 为当前设置标题图形。
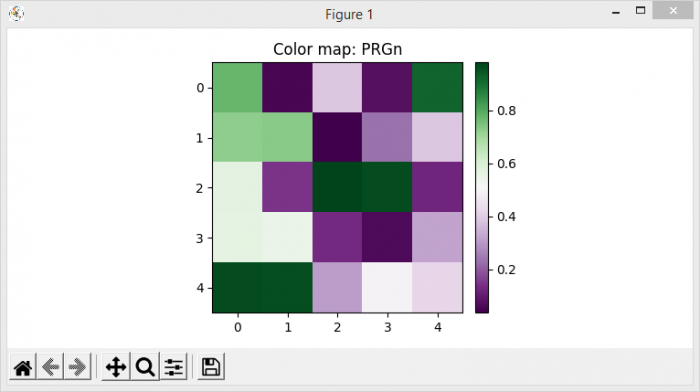
- 使用 matplotlib 中可用的所有颜色图为图像制作动画。
- 通过重复调用函数制作动画。
- 要显示图形,请使用 show() 方法。
示例
import numpy as np
import matplotlib.pyplot as plt
import matplotlib.animation as animation
from mpl_toolkits.axes_grid1 import make_axes_locatable

plt.rcParams["figure.figsize"] = [7.50, 3.50]
plt.rcParams["figure.autolayout"] = True

fig = plt.figure()
ax = fig.add_subplot(111)
div = make_axes_locatable(ax)
cax = div.append_axes('right', '5%', '5%')
data = np.random.rand(5, 5)
im = ax.imshow(data)
cb = fig.colorbar(im, cax=cax)
cmap = plt.colormaps()
tx = ax.set_title('Color map: {0}'.format(cmap[0]))

def animate(i):
   cax.cla()
   data = np.random.rand(5, 5)
   im = ax.imshow(data, cmap=cmap[i])
   fig.colorbar(im, cax=cax)
   tx.set_text('Color map: {0}'.format(cmap[i]))

ani = animation.FuncAnimation(fig, animate, frames=166)

plt.show()
输出
相关文章
有用资源
python 参考教程 - 该教程包含有关 python 的更多信息:https://www.cainiaomax.com/python/

