
通过命令行使用 Python Matplotlib 进行交互式绘图
matplotlibpythondata visualization更新于 2025/6/3 13:32:17
要获得交互式绘图,我们需要激活图形。使用 plt.ioff() 和 plt.ion(),我们可以对绘图执行交互式操作。
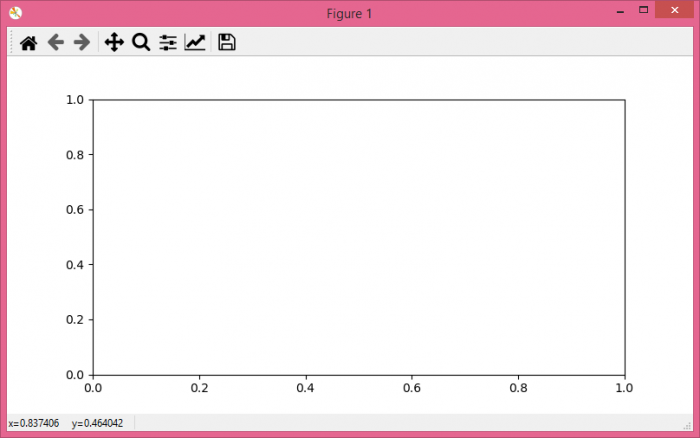
打开 Ipython shell 并在 shell 上输入以下命令。
示例
In [1]: %matplotlib auto
Using matplotlib backend: GTK3Agg

In [2]: import matplotlib.pyplot as

In [3]: fig, ax = plt.subplots() # 图表会弹出。让我们互动吧。

In [4]: ln, = ax.plot(range(5))  # 画一条线

In [5]: ln.set_color("orange")   # 将绘制的线改为橙色

In [6]: plt.ioff() # 停止互动

In [7]: ln.set_color("red")
# 由于我们在最后一步停止了交互

In [8]: plt.ion() # 开始互动
输出
相关文章
有用资源
python 参考教程 - 该教程包含有关 python 的更多信息:https://www.cainiaomax.com/python/

