
使用 Python 进行卷积简介
pythonserver side programmingprogramming更新于 2025/10/26 10:52:17
在本文中,我们将学习 Python 3.x 或更早版本中的卷积。本文涉及神经网络和特征提取。
首选 Ide − Jupyter 笔记本
先决条件 − 已安装 Numpy,已安装 Matplotlib
安装
>>> pip install numpy
>>>pip install matplotlib
卷积
卷积是一种可以在图像上执行的操作,通过在图像上应用一个较小的容器(称为内核/坐标容器,如滑动窗口)来从图像中提取特征。根据卷积坐标容器中的值,我们可以从图像中获取特定的模式/特征。在这里,我们将学习使用适当的坐标容器检测图像中的水平和垂直端点。
现在让我们看看实际的实现。
示例
import numpy as np
from matplotlib import pyplot
# 初始化图像
img1 = np.array([np.array([100, 100]), np.array([80, 80])])
img2 = np.array([np.array([100, 100]), np.array([50, 0])])
img3 = np.array([np.array([100, 50]), np.array([100, 0])])
coordinates_horizontal = np.array([np.array([3, 3]), np.array([-3, -3])])
print(coordinates_horizontal, "是检测水平端点的坐标")
coordinates_vertical = np.array([np.array([3, -3]), np.array([3, - 3])])
print(coordinates_vertical, "是检测垂直端点的坐标")
#这将是一个元素乘法,然后是加法
def apply_coordinates(img, coordinates):
return np.sum(np.multiply(img, coordinates))
# 可视化 img1
pyplot.imshow(img1)
pyplot.axis('off')
pyplot.title('sample 1')
pyplot.show()
# 检查 image1 中的水平和垂直特征
print('水平端点特征得分:',
apply_coordinates(img1, coordinates_horizontal))
print('垂直端点特征得分:',
apply_coordinates(img1,coordinates_vertical))
# 可视化 img2
pyplot.imshow(img2)
pyplot.axis('off')
pyplot.title('sample 2')
pyplot.show()
# 检查 image1 中的水平和垂直特征image2
print('水平端点特征得分:',
apply_coordinates(img2, coordinates_horizontal))
print('垂直端点特征得分:',
apply_coordinates(img2, coordinates_vertical))
# 可视化 img3
pyplot.imshow(img3)
pyplot.axis('off')
pyplot.title('sample 3')
pyplot.show()
# 检查 image1 中的水平和垂直特征
print('水平端点特征得分:',
apply_coordinates(img3,coordinates_horizontal))
print('垂直端点特征得分:',
apply_coordinates(img3,coordinates_vertical))
输出
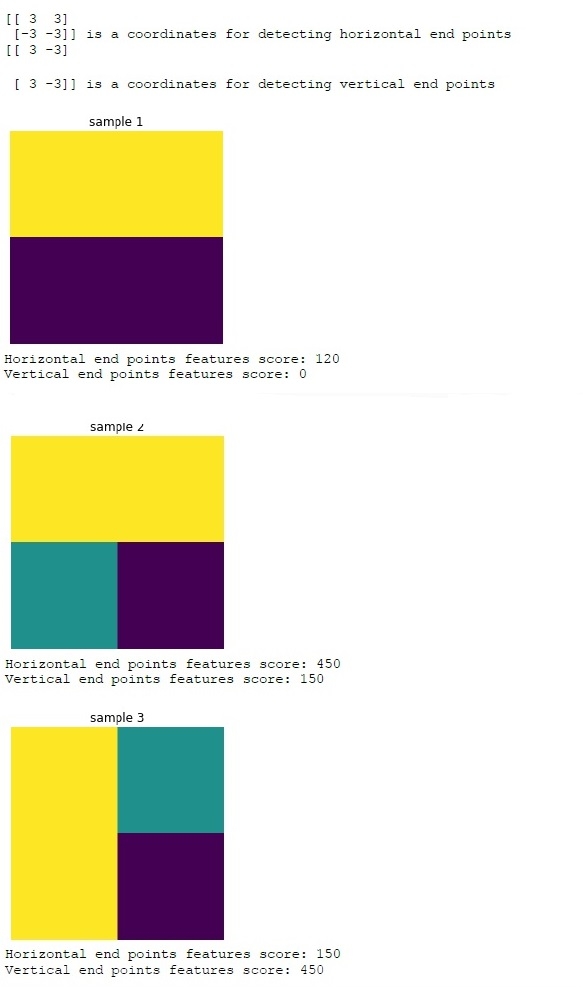
结论
在本文中,我们了解了使用 Python 3.x 或更早版本进行卷积入门及其实现。
相关文章
有用资源
python 参考教程 - 该教程包含有关 python 的更多信息:https://www.cainiaomax.com/python/