在 Ubuntu 中显示 Matplotlib 图表(和其他 GUI)
matplotlibubuntuserver side programmingprogramming更新于 2025/9/17 12:37:17
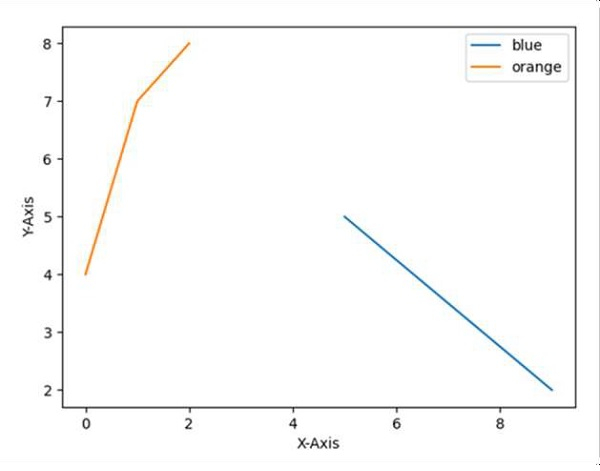
使用 matplotlib 的 plot 方法并使用不同的颜色设置图例。
步骤
使用 plt.xlabel() 方法设置 X 轴标签。
使用 plt.ylabel() 方法设置 Y 轴标签。
使用 plt.plot() 方法,以 [9, 5]、[2, 5] 和 [4, 7, 8] 数组为参数绘制线条。
初始化两个变量; location = 0 表示最佳位置,border_drawn_flag = True(如果要为图例绘制边框,则为 True;如果不绘制边框,则为 False)。
使用 plt.legend() 方法设置图例,并相应地设置 location 和 border_drawn_flag,以在图表中获得完美的图例。
使用 plt.show() 方法显示图形。
示例
import matplotlib.pyplot as plt

plt.ylabel("Y-axis ")
plt.xlabel("X-axis ")

plt.plot([9, 5], [2, 5], [4, 7, 8])

location = 0 # For the best location
legend_drawn_flag = True
plt.legend(["blue", "orange"], loc=0, frameon=legend_drawn_flag)

plt.show()
输出