
GWT Highcharts - 堆叠面积图
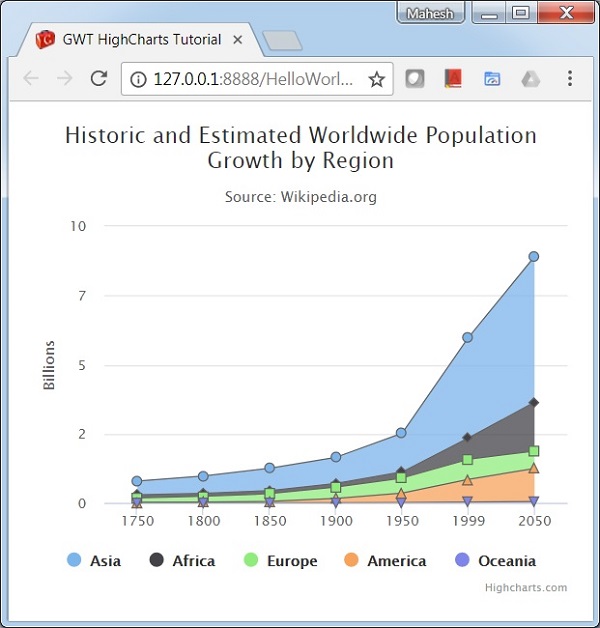
以下是堆叠面积图的示例。
我们已经在Highcharts 配置语法一章中看到了用于绘制图表的配置。现在,让我们看一个堆叠面积图的示例。
plotOptions
plotOptions 是每个系列类型的配置对象的包装器对象。可以覆盖系列数组中给出的每个系列项目的配置对象。这是将每个系列的值堆叠在一起。
使用 plotOptions.area.stacking 将图表的堆叠配置为"正常"。可能的值是 null(禁用堆叠)、"normal"按值堆叠和"percent"按百分比堆叠图表。
chart.setAreaPlotOptions(new AreaPlotOptions()
   .setStacking(Stacking.NORMAL)
   .setLineColor("#666666")
   .setLineWidth(1)
   .setMarker(new Marker()
      .setLineWidth(1)
      .setLineColor("#666666")
   )
);
示例
HelloWorld.java
package com.tutorialspoint.client;

import org.moxieapps.gwt.highcharts.client.Chart;
import org.moxieapps.gwt.highcharts.client.Series.Type;
import org.moxieapps.gwt.highcharts.client.ToolTip;
import org.moxieapps.gwt.highcharts.client.ToolTipData;
import org.moxieapps.gwt.highcharts.client.ToolTipFormatter;
import org.moxieapps.gwt.highcharts.client.XAxis;
import org.moxieapps.gwt.highcharts.client.YAxis;

import org.moxieapps.gwt.highcharts.client.labels.AxisLabelsData;
import org.moxieapps.gwt.highcharts.client.labels.AxisLabelsFormatter;
import org.moxieapps.gwt.highcharts.client.labels.YAxisLabels;

import org.moxieapps.gwt.highcharts.client.plotOptions.AreaPlotOptions;
import org.moxieapps.gwt.highcharts.client.plotOptions.Marker;
import org.moxieapps.gwt.highcharts.client.plotOptions.PlotOptions.Stacking;

import com.google.gwt.core.client.EntryPoint;
import com.google.gwt.i18n.client.NumberFormat;
import com.google.gwt.user.client.ui.RootPanel;

public class HelloWorld implements EntryPoint {
   public void onModuleLoad() {
      Chart chart = new Chart()
         .setType(Type.AREA)
         .setChartTitleText("Historic and Estimated Worldwide Population Growth by Region")
         .setChartSubtitleText("Source: Wikipedia.org")
         .setAreaPlotOptions(new AreaPlotOptions()
            .setStacking(Stacking.NORMAL)
            .setLineColor("#666666")
            .setLineWidth(1)
            .setMarker(new Marker()
               .setLineWidth(1)
               .setLineColor("#666666")
            )
         )
         .setToolTip(new ToolTip()
         .setFormatter(new ToolTipFormatter() {
            @Override
            public String format(ToolTipData toolTipData) {
               return toolTipData.getXAsString() + ": " +
                  NumberFormat.getFormat("0.0").format(toolTipData.getPercentage()) + "% (" +
                  NumberFormat.getFormat("#,###").format(toolTipData.getYAsDouble()) + " millions)";
            }
         }));

         XAxis xAxis = chart.getXAxis();
         xAxis.setCategories("1750", "1800", "1850", "1900", "1950", "1999", "2050");
         xAxis.setTickmarkPlacement(XAxis.TickmarkPlacement.ON);
         xAxis.setAxisTitleText(null);

         YAxis yAxis = chart.getYAxis();
         yAxis.setAxisTitleText("Billions");
         yAxis.setLabels(new YAxisLabels()
            .setFormatter(new AxisLabelsFormatter() {
               @Override
               public String format(AxisLabelsData axisLabelsData) {
                  return String.valueOf(axisLabelsData.getValueAsLong() / 1000);
               }
            }));

         chart.addSeries(chart.createSeries()
            .setName("Asia")
            .setPoints(new Number[] { 502, 635, 809, 947, 1402, 3634, 5268 })
         );
         chart.addSeries(chart.createSeries()
            .setName("Africa")
            .setPoints(new Number[] { 106, 107, 111, 133, 221, 767, 1766 })
         );
         chart.addSeries(chart.createSeries()
            .setName("Europe")
            .setPoints(new Number[] { 163, 203, 276, 408, 547, 729, 628 })
         );
         chart.addSeries(chart.createSeries()
            .setName("America")
            .setPoints(new Number[] { 18, 31, 54, 156, 339, 818, 1201 })
         );
         chart.addSeries(chart.createSeries()
            .setName("Oceania")
            .setPoints(new Number[] { 2, 2, 2, 6, 13, 30, 46 })
         );
      RootPanel.get().add(chart);
   }
}
结果
验证结果。
 gwt_highcharts_area_charts.html

