
GWT Highcharts - 基本饼图
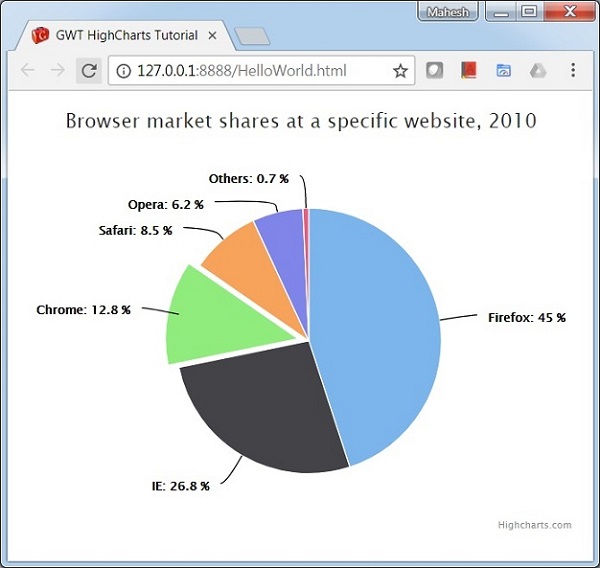
以下是饼图的示例。
我们已经在Highcharts 配置语法一章中看到了用于绘制图表的配置。现在,让我们看一个基本饼图的示例。我们还将了解其他配置。我们已更改图表中的 type 属性。
chart
将图表类型配置为基于"饼图"。chart.type 决定图表的系列类型。此处,默认值为"线"。
chart.setType(Type.PIE);
示例
HelloWorld.java
package com.tutorialspoint.client;

import org.moxieapps.gwt.highcharts.client.Chart;
import org.moxieapps.gwt.highcharts.client.Legend;
import org.moxieapps.gwt.highcharts.client.Point;
import org.moxieapps.gwt.highcharts.client.Series.Type;
import org.moxieapps.gwt.highcharts.client.Style;

import org.moxieapps.gwt.highcharts.client.ToolTip;
import org.moxieapps.gwt.highcharts.client.ToolTipData;
import org.moxieapps.gwt.highcharts.client.ToolTipFormatter;

import org.moxieapps.gwt.highcharts.client.labels.DataLabels;
import org.moxieapps.gwt.highcharts.client.labels.DataLabelsData;
import org.moxieapps.gwt.highcharts.client.labels.DataLabelsFormatter;
import org.moxieapps.gwt.highcharts.client.labels.PieDataLabels;
import org.moxieapps.gwt.highcharts.client.labels.Labels.Align;
import org.moxieapps.gwt.highcharts.client.labels.XAxisLabels;

import org.moxieapps.gwt.highcharts.client.plotOptions.ColumnRangePlotOptions;
import org.moxieapps.gwt.highcharts.client.plotOptions.PiePlotOptions;
import org.moxieapps.gwt.highcharts.client.plotOptions.PlotOptions.Cursor;

import com.google.gwt.core.client.EntryPoint;
import com.google.gwt.i18n.client.NumberFormat;
import com.google.gwt.user.client.ui.RootPanel;

public class HelloWorld implements EntryPoint {
   public void onModuleLoad() {
      final Chart chart = new Chart()
         .setType(Type.PIE)
         .setChartTitleText("Browser market shares at a specific website, 2010")
         .setPlotBackgroundColor((String)null)
         .setPlotBorderWidth(null)
         .setPlotShadow(false)
         .setPiePlotOptions(new PiePlotOptions()
            .setAllowPointSelect(true)
            .setCursor(Cursor.POINTER)
            .setPieDataLabels(new PieDataLabels()
               .setConnectorColor("#000000")
               .setEnabled(true)
               .setColor("#000000")
               .setFormatter(new DataLabelsFormatter() {
                  @Override
                  public String format(DataLabelsData dataLabelsData) {
                     return "<b>" + dataLabelsData.getPointName() + "</b>: " + dataLabelsData.getYAsDouble() + " %";
                  }
               })
            )
         )
         .setLegend(new Legend()
            .setLayout(Legend.Layout.VERTICAL)
            .setAlign(Legend.Align.RIGHT)
            .setVerticalAlign(Legend.VerticalAlign.TOP)
            .setX(-100)
            .setY(100)
            .setFloating(true)
            .setBorderWidth(1)
            .setBackgroundColor("#FFFFFF")
            .setShadow(true)
         )
         .setToolTip(new ToolTip()
            .setFormatter(new ToolTipFormatter() {
               @Override
               public String format(ToolTipData toolTipData) {
                  return "<b>" + toolTipData.getPointName() + "</b>: " + toolTipData.getYAsDouble() + " %";
               }
            })
         );

         chart.addSeries(chart.createSeries()
            .setName("Browser share")
            .setPoints(new Point[]{
               new Point("Firefox", 45.0),
               new Point("IE", 26.8),
               new Point("Chrome", 12.8)
                  .setSliced(true)
                  .setSelected(true),
               new Point("Safari", 8.5),
               new Point("Opera", 6.2),
               new Point("Others", 0.7)
            })
         );
      RootPanel.get().add(chart);
   }
}
结果
验证结果。
 gwt_highcharts_pie_charts.html

