
具有加点功能的图表
我们已经在Highcharts 配置语法章节中看到了用于绘制图表的配置。
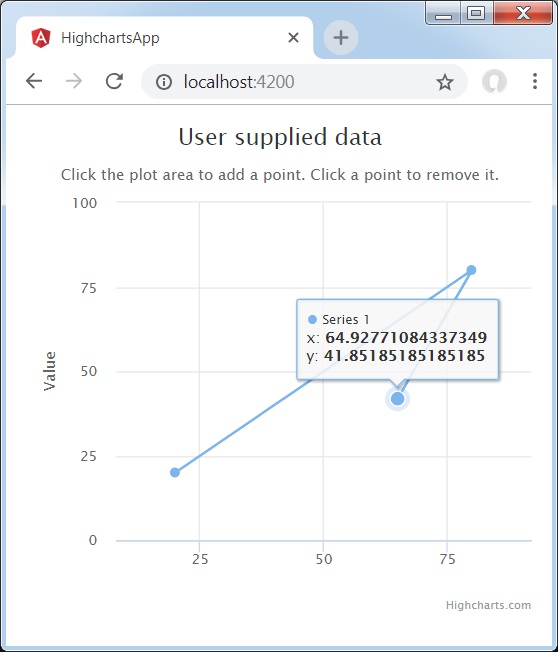
下面给出了具有加点功能的图表示例。
配置
现在让我们看看采取的其他配置/步骤。
chart.events
向 chart.event 属性添加一个 click 方法。 此方法使用图表中单击区域的 x、y 坐标将新点添加到系列 series 中。
events: {
   click: function (e) {
      // 找到点击的值和系列
      var x = e.xAxis[0].value,
      y = e.yAxis[0].value,
      series = this.series[0];
      // 添加它
      series.addPoint([x, y]);
   }
}
示例
app.component.ts
import { Component } from '@angular/core';
import * as Highcharts from 'highcharts';
@Component({
  selector: 'app-root',
  templateUrl: './app.component.html',
  styleUrls: ['./app.component.css']
})
export class AppComponent {
   highcharts = Highcharts;
   chartOptions = {
      chart : {
         type: 'scatter',
         margin: [70, 50, 60, 80],
         marginRight: 10,
         events: {
            click: function (e) {
              // 找到点击的值和系列
              var x = e.xAxis[0].value,
              y = e.yAxis[0].value,
              series = this.series[0];

              // 添加它
              series.addPoint([x, y]);
           }
        }
      },
      title : {
         text: 'User supplied data'
      },
      subtitle : {
         text: '单击绘图区域以添加一个点。 单击一个点将其删除。'
      },
      xAxis : {
         gridLineWidth: 1,
         minPadding: 0.2,
         maxPadding: 0.2,
         maxZoom: 60
      },
      yAxis : {
         title: {
            text: 'Value'
         },
         minPadding: 0.2,
         maxPadding: 0.2,
         maxZoom: 60,
         plotLines: [{
            value: 0,
            width: 1,
            color: '#808080'
         }]
      },
      plotOptions: {
         series: {
            lineWidth: 1,
            point: {
               events: {
                  'click': function () {
                     if (this.series.data.length > 1) {
                        this.remove();
                     }
                  }
               }
            }
         }
      },
      legend: {
         enabled: false
      },
      exporting : {
         enabled: false
      },
      series : [{
         data: [[20, 20], [80, 80]]
      }]
   };
}
结果
验证结果。
❮ angular_highcharts_dynamic_charts.html

