Angular Highcharts - 散点图
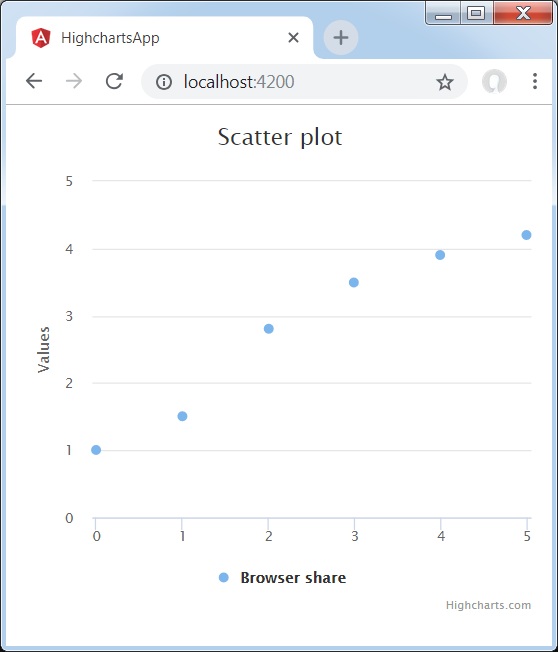
以下是基本散点图的示例。
我们已经在Highcharts 配置语法章节中看到了用于绘制图表的配置。
下面给出了基本散点图的示例。
配置
现在让我们看看采取的其他配置/步骤。
series 系列
将图表类型配置为基于散点图。 series.type 决定图表的系列类型。 这里,默认值为"line"。
var chart = {
   type: 'scatter',
   zoomType: 'xy'
};
示例
app.component.ts
import { Component } from '@angular/core';
import * as Highcharts from 'highcharts';
@Component({
  selector: 'app-root',
  templateUrl: './app.component.html',
  styleUrls: ['./app.component.css']
})
export class AppComponent {
   highcharts = Highcharts;
   chartOptions = {
      title : {
         text: 'Scatter plot'
      },
      series : [{
         type: 'scatter',
         zoomType:'xy',
         name: 'Browser share',
         data: [ 1, 1.5, 2.8, 3.5, 3.9, 4.2 ]
      }]
   };
}
结果
验证结果。