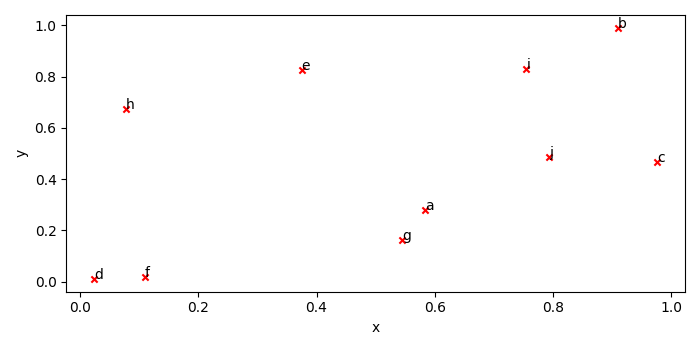
在从 Pandas DataFrame 绘图时注释数据点
pandasmatplotlibserver side programmingprogramming更新于 2025/9/7 7:30:00
要在从 Pandas 数据框绘图时注释数据点,我们可以采取以下步骤 −
使用带有 x、y 和索引键的 DataFrame 创建 df。
使用 subplots()方法创建一个图形和一组子图。
使用plot()方法、kind='scatter'、ax=ax、c='red' 和 marker='x'绘制一系列数据框。
要使用索引值注释散点,请迭代数据框架。
要显示图形,请使用 show() 方法。
示例
import numpy as np
import pandas as pd
from matplotlib import pyplot as plt
import string
plt.rcParams["figure.figsize"] = [7.00, 3.50]
plt.rcParams["figure.autolayout"] = True
df = pd.DataFrame({'x': np.random.rand(10), 'y': np.random.rand(10)}, index=list(string.ascii_lowercase[:10]))
fig, ax = plt.subplots()
df.plot('x', 'y', kind='scatter', ax=ax, c='red', marker='x')
for k, v in df.iterrows():
   ax.annotate(k, v)
plt.show()
输出