如何更改 Pandas hist 命令中的绘图顺序?
pandasmatplotlibserver side programmingprogramming更新于 2025/4/30 19:07:17
要更改 Pandas hist 命令中的绘图顺序,我们可以采取以下步骤 −
使用 Pandas 创建数据框。
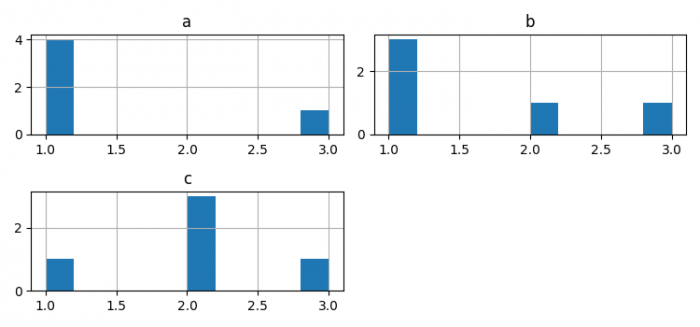
使用数据框绘制直方图。
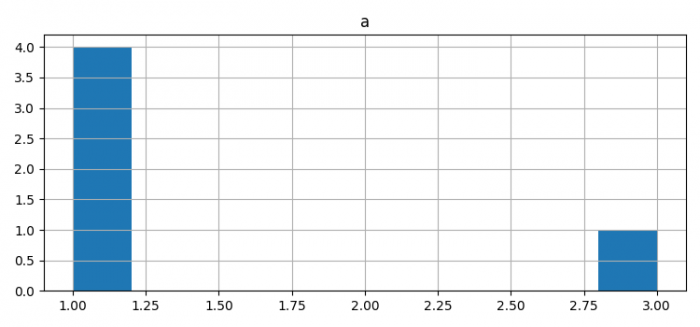
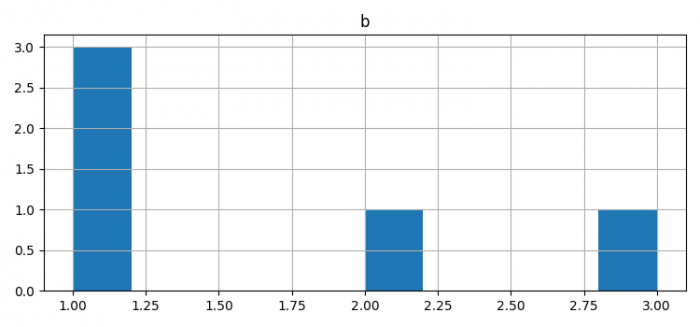
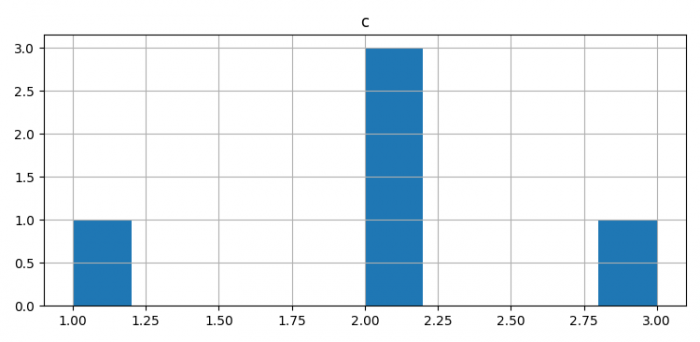
以不同的顺序绘制数据框。
要显示图形,请使用 show() 方法。
示例
from matplotlib import pyplot as plt
import pandas as pd
plt.rcParams["figure.figsize"] = [7.50, 3.50]
plt.rcParams["figure.autolayout"] = True
df = pd.DataFrame({'a': [1, 1, 1, 1, 3],
   'b': [1, 1, 2, 1, 3],
   'c': [2, 2, 2, 1, 3],
})

df.hist()
df[['c']].hist()
df[['a']].hist()
df[['b']].hist()
plt.show()
输出