
如何在网页上嵌入交互式 Matplotlib 图?
matplotlibpythondata visualization更新于 2025/6/24 1:16:17
要在网页上显示图以使图具有交互性,我们可以采取以下步骤 −
- 安装 Bokeh 并导入 figure、show 和 output_file。
- 配置默认输出状态以在调用 :func:'show' 时生成保存到文件的输出。
- 创建一个新的 Figure 进行绘图。
- 渲染从给定 URL 加载的图像。
- 立即显示 Bokeh 对象或应用程序。
示例
from bokeh.plotting import figure, show, output_file

output_file('image.html')
p = figure(x_range=(0, 1), y_range=(0, 1))

p.image_url(url=['bird.jpg'], x=0, y=1, w=0.8, h=0.6)
show(p)
输出
当我们执行代码时,它将在您的默认浏览器上显示以下图像。
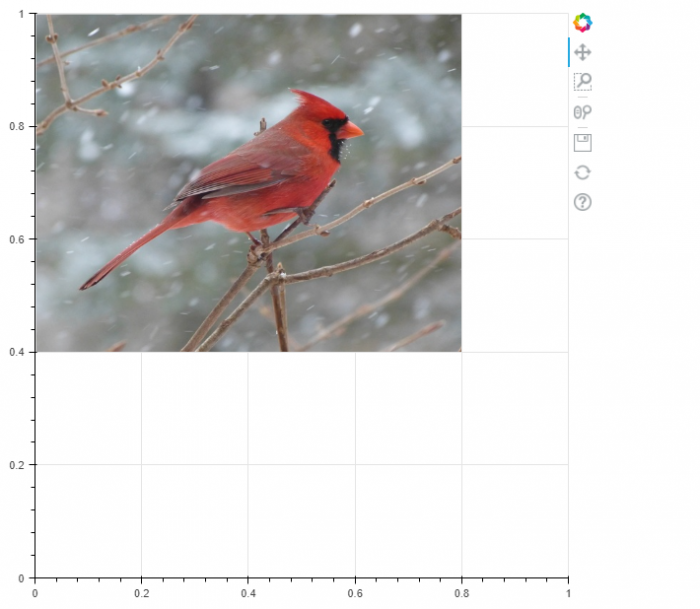
您可以在浏览器上移动图像,因为该图是交互式的
相关文章
有用资源
python 参考教程 - 该教程包含有关 python 的更多信息:https://www.cainiaomax.com/python/

