Bokeh - 使用 JavaScript 开发
Bokeh Python 库以及其他语言(例如 R、Scala 和 Julia)的库主要与 BokehJS 进行高层交互。 Python 程序员不必担心 JavaScript 或 Web 开发。 然而,可以使用 BokehJS API,直接使用 BokehJS 进行纯 JavaScript 开发。
BokehJS 对象(例如字形和小部件)的构建或多或少与 Bokeh Python API 中的类似。 通常,任何 Python ClassName 都可以作为 JavaScript 的 Bokeh.ClassName 使用。 例如,在 Python 中获得的 Range1d 对象。
xrange = Range1d(start=-0.5, end=20.5)
用 BokehJS 等价获得为 −
var xrange = new Bokeh.Range1d({ start: -0.5, end: 20.5 });
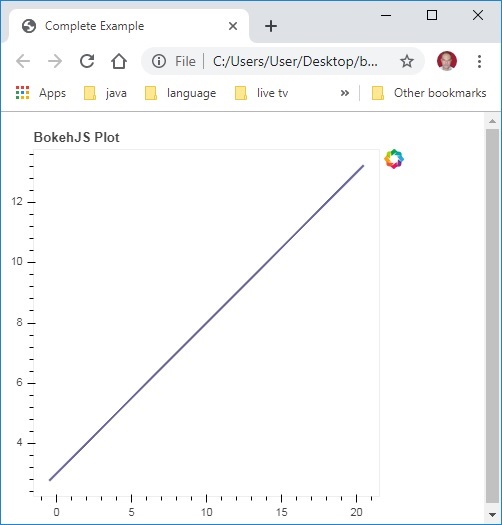
嵌入 HTML 文件中的 JavaScript 代码会在浏览器中呈现一个简单的线图。
首先在网页的 <head>..</head> 部分中包含所有的BokehJS库,如下所示
<head>
<script type="text/javascript" src="https://cdn.pydata.org/bokeh/release/bokeh-1.3.4.min.js"></script>
<script type="text/javascript" src="https://cdn.pydata.org/bokeh/release/bokeh-widgets-1.3.4.min.js"></script>
<script type="text/javascript" src="https://cdn.pydata.org/bokeh/release/bokeh-tables-1.3.4.min.js"></script>
<script type="text/javascript" src="https://cdn.pydata.org/bokeh/release/bokeh-gl-1.3.4.min.js"></script>
<script type="text/javascript" src="https://cdn.pydata.org/bokeh/release/bokeh-api-1.3.4.min.js"></script>
<script type="text/javascript" src="https://cdn.pydata.org/bokeh/release/bokeh-api-1.3.4.min.js"></script>
</head>
在正文部分,以下 JavaScript 片段构建了散景图的各个部分。
<script>
// create some data and a ColumnDataSource
var x = Bokeh.LinAlg.linspace(-0.5, 20.5, 10);
var y = x.map(function (v) { return v * 0.5 + 3.0; });
var source = new Bokeh.ColumnDataSource({ data: { x: x, y: y } });
// make the plot
var plot = new Bokeh.Plot({
   title: "BokehJS Plot",
   plot_width: 400,
   plot_height: 400
});

// add axes to the plot
var xaxis = new Bokeh.LinearAxis({ axis_line_color: null });
var yaxis = new Bokeh.LinearAxis({ axis_line_color: null });
plot.add_layout(xaxis, "below");
plot.add_layout(yaxis, "left");

// add a Line glyph
var line = new Bokeh.Line({
   x: { field: "x" },
   y: { field: "y" },
   line_color: "#666699",
   line_width: 2
});
plot.add_glyph(line, source);

Bokeh.Plotting.show(plot);
</script>
将以上代码保存为网页,并在您选择的浏览器中打开。