
Google Colab - 图形输出
Colab 还支持图表等丰富的输出。在代码单元格中输入以下代码。
import numpy as np
from matplotlib import pyplot as plt

y = np.random.randn(100)
x = [x for x in range(len(y))]

plt.plot(x, y, '-')
plt.fill_between(x, y, 200, where = (y > 195), facecolor='g', alpha=0.6)

plt.title("Sample Plot")
plt.show()
现在,如果您运行代码,您将看到以下输出 −
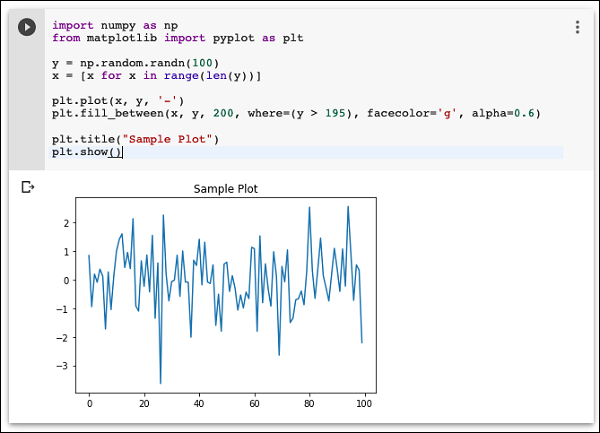
请注意,图形输出显示在代码单元格的输出部分。同样,您将能够在整个程序代码中创建和显示多种类型的图表。
现在,您已经熟悉了 Colab 的基础知识,让我们继续了解 Colab 中可让您的 Python 代码开发更轻松的功能。

