Matplotlib - 处理文本
Matplotlib 具有广泛的文本支持,包括对数学表达式的支持、对栅格和矢量输出的 TrueType 支持、具有任意旋转的换行符分隔文本以及 unicode 支持。 Matplotlib 包括它自己的 matplotlib.font_manager,它实现了跨平台、符合 W3C 的字体查找算法。
用户对文本属性(字体大小、字体粗细、文本位置和颜色等)有很大的控制权。 Matplotlib 实现大量 TeX 数学符号和命令。
以下命令列表用于在 Pyplot 界面中创建文本 −
| text | 在坐标轴的任意位置添加文本。 |
| annotate | 在坐标轴的任意位置添加带有可选箭头的注释。 |
| xlabel | 为 Axes 的 x 坐标轴添加标签。 |
| ylabel | 向 Axes 的 y 坐标轴添加标签。 |
| title | 为坐标轴添加标题。 |
| figtext | 在图形的任意位置添加文本。 |
| suptitle | 为图添加标题。 |
所有这些函数都创建并返回一个 matplotlib.text.Text() 实例。
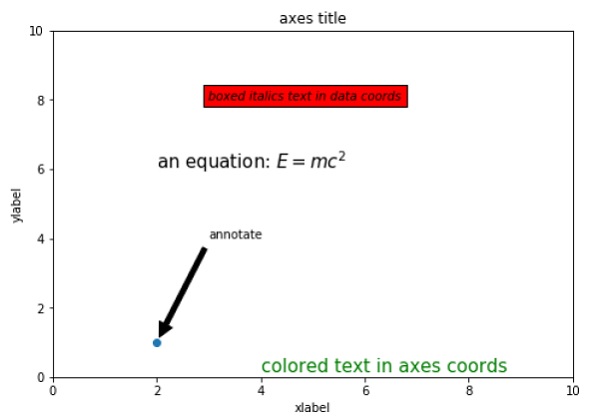
以下脚本演示了上述部分功能的使用 −
import matplotlib.pyplot as plt
fig = plt.figure()

ax = fig.add_axes([0,0,1,1])

ax.set_title('axes title')
ax.set_xlabel('xlabel')
ax.set_ylabel('ylabel')
ax.text(3, 8, 'boxed italics text in data coords', style='italic',
bbox = {'facecolor': 'red'})
ax.text(2, 6, r'an equation: $E = mc^2$', fontsize = 15)
ax.text(4, 0.05, 'colored text in axes coords',
verticalalignment = 'bottom', color = 'green', fontsize = 15)
ax.plot([2], [1], 'o')
ax.annotate('annotate', xy = (2, 1), xytext = (3, 4),
arrowprops = dict(facecolor = 'black', shrink = 0.05))
ax.axis([0, 10, 0, 10])
plt.show()
上面这行代码会产生如下输出 −