SAS - Bland Altman 分析
Bland-Altman 分析是验证设计用于测量相同参数的两种方法之间的一致或不一致程度的过程。方法之间的高度相关性表明在数据分析中选择了足够好的样本。在 SAS 中,我们通过计算变量值的平均值、上限和下限来创建 Bland-Altman 图。 然后我们使用 PROC SGPLOT 创建 Bland-Altman 图。
语法
在 SAS 中应用 PROC SGPLOT 的基本语法是 −
PROC SGPLOT DATA = dataset;
SCATTER X = variable Y = Variable;
REFLINE value;
以下是使用的参数说明 −
Dataset 是数据集的名称。
SCATTER 语句 cerates 以 X 和 Y 的形式提供的值的散点图。
REFLINE 创建水平或垂直参考线。
示例
在下面的示例中,我们采用了两个名为 new 和 old 的方法生成的两个实验的结果。我们计算变量值的差异以及同一观察变量的平均值。 我们还计算了用于计算上限和下限的标准偏差值。
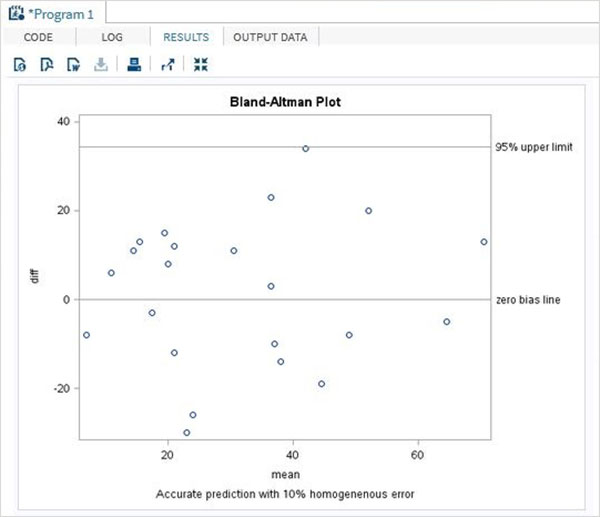
结果将 Bland-Altman 图显示为散点图。
data mydata;
input new old;
datalines;
31 45
27 12
11 37
36 25
14 8
27 15
3 11
62 42
38 35
20 9
35 54
62 67
48 25
77 64
45 53
32 42
16 19
15 27
22 9
8 38
24 16
59 25
;

data diffs ;
set mydata ;
/* calculate the difference */
diff = new-old ;
/* calculate the average */
mean = (new+old)/2 ;
run ;
proc print data = diffs;
run;

proc sql noprint ;
select mean(diff)-2*std(diff),  mean(diff)+2*std(diff)
into   :lower,  :upper
from diffs ;
quit;

proc sgplot data = diffs ;
scatter x = mean y = diff;
refline 0 &upper &lower / LABEL = ("zero bias line" "95% upper limit" "95%
lower limit");
TITLE 'Bland-Altman Plot';
footnote 'Accurate prediction with 10% homogeneous error';
run ;
quit ;
当上面的代码执行时,我们得到如下结果 −
增强模型
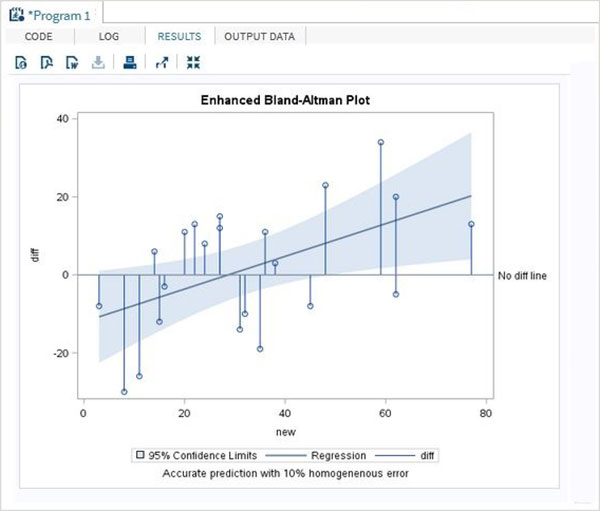
在上述程序的增强模型中,我们得到 95% 的置信水平曲线拟合。
proc sgplot data = diffs ;
reg x = new y = diff/clm clmtransparency = .5;
needle x = new y = diff/baseline = 0;
refline 0 / LABEL = ('No diff line');
TITLE 'Enhanced Bland-Altman Plot';
footnote 'Accurate prediction with 10% homogeneous error';
run ;
quit ;
当上面的代码执行时,我们得到如下结果 −