
子图中的 Python xticks
pythonmatplotlibserver side programmingprogramming更新于 2024/9/22 2:52:17
子图可以将图形拆分为 nrow*ncols 部分,plt.xticks 可以帮助绘制子图的 xticks。
步骤
为第 1 行和第 2 行创建两个列表。
向当前图形添加子图,nrow = 1、ncols = 2 和 index = 1。
绘制第 1 行,样式为虚线。
设置或检索自动缩放边距(0.2)。
将 xticks 放置在偶数位置。
设置 X 轴的标题。
向当前图形添加子图,nrow = 1, ncols = 2 且 index = 2。
绘制线 2。
设置或检索自动缩放边距 (0.2)。
将 xticks 放置在奇数位置。
设置 X 轴的标题。
要显示图形,请使用 plt.show() 方法。
示例
import matplotlib.pyplot as plt

line1 = [21, 14, 81]
line2 = [31, 6, 12]

plt.subplot(121)
plt.plot(line1, linestyle='dashed')
plt.margins(0.2)
plt.xticks([2, 4, 6, 8, 10])
plt.title("x-ticks at even places")

plt.subplot(122)
plt.plot(line2)
plt.margins(0.2)
plt.xticks([1, 3, 5, 7, 9])
plt.title("x-ticks at odd places")

plt.show()
输出
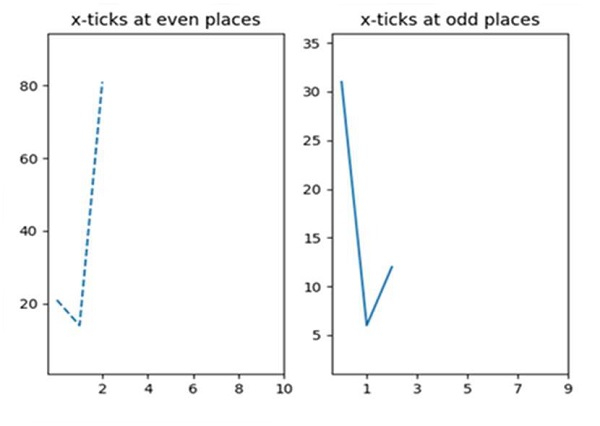
相关文章
有用资源
python 参考教程 - 该教程包含有关 python 的更多信息:https://www.cainiaomax.com/python/

