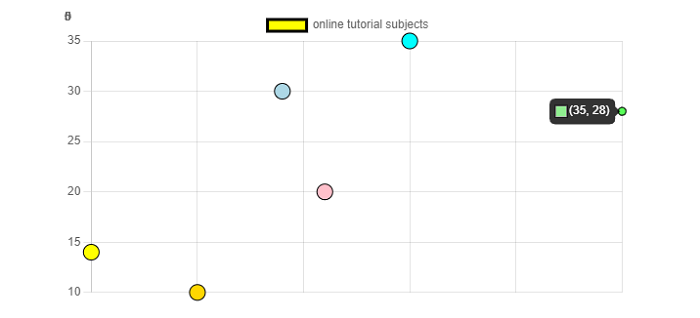
Chart.js - 散点图
Chart.js 散点图基本上基于简单的折线图,但其 X 轴更改为线性轴。创建散点图时,必须将数据作为包含 X 和 Y 属性的对象传递。
以下是气泡图中数据集属性要使用的命名空间 −
data.datasets[index] − 它仅为此数据集提供选项。
options.datasets.scatter − 它为所有散点数据集提供选项。
options.datasets.line − 它为所有线数据集提供选项。
options.elements.point −它为所有点元素提供选项。
Options − 它为整个图表提供选项
我们需要使用 type: "scatter" 来创建散点图。
示例
让我们举一个例子,借助它我们将创建一个散点图 −
<!DOCTYPE>
<html>
<head>
   <meta charset- "UTF-8" />
   <meta name="viewport" content="width=device-width, initial-scale=1" />
   <title>chart.js</title>
</head>
<body>
   <canvas id="chartId" aria-label="chart" height="300" width="580"></canvas>
   <script src="https://cdnjs.cloudflare.com/ajax/libs/Chart.js/3.1.1/chart.min.js"></script>
   <script>
      var chrt = document.getElementById("chartId").getContext("2d");
      var chartId = new Chart(chrt, {
         type: 'scatter',
         data: {
            labels: ["HTML", "CSS", "JAVASCRIPT", "CHART.JS", "JQUERY", "BOOTSTRP"],
            datasets: [{
               label: "online tutorial subjects",
               data: [
                  {x:10, y:14},
                  {x:25, y:35},
                  {x:21, y:20},
                  {x:35, y:28},
                  {x:15, y:10},
                  {x:19, y:30},
               ],
               backgroundColor: ['yellow', 'aqua', 'pink', 'lightgreen', 'gold', 'lightblue'],
               borderColor: ['black'],
               radius: 8,
            }],
         },
         options: {
            responsive: false,
            scales: {
               x: {
                  type: 'linear',
                  position: 'bottom,'
               }
            }
         },
      });
   </script>
</body>
</html>
输出