Chart.js - 工具提示
Chart.js 工具提示为我们提供了一个在图表中显示工具提示文本的选项。工具提示是一个图形 UI 元素,当我们将鼠标悬停在图表元素上时,它会提供额外的信息。动画配置的命名空间是 options.plugins.tooltip。
语法
图表工具提示语法如下−
options: {
   plugins: {
      tooltip: {
         enabled: true,
         (Write tooltip's style element)
      },
   }
}
工具提示 enabled 属性必须为 true 才能显示数据标签。如果设置为 false,则 工具提示 将停用。
示例
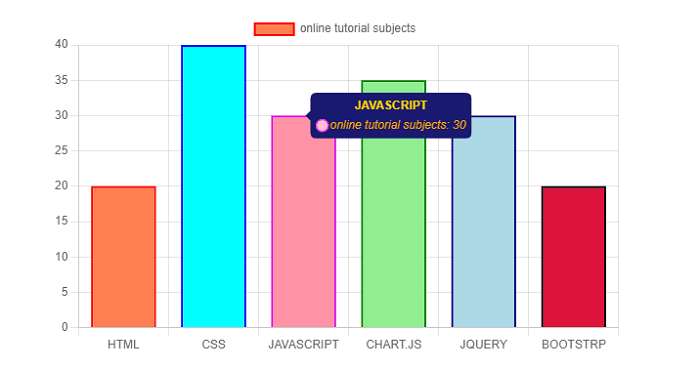
让我们举一个例子,其中我们将使用各种工具提示配置−
<!DOCTYPE>
<html>
<head>
   <meta charset- "UTF-8" />
   <meta name="viewport" content="width=device-width, initial-scale=1" />
   <title>chart.js</title>
</head>
<body>
   <canvas id="chartId" aria-label="chart" height="350" width="580"></canvas>
   <script src="https://cdnjs.cloudflare.com/ajax/libs/Chart.js/3.1.1/chart.min.js"></script>
   <script src="https://cdnjs.cloudflare.com/ajax/libs/Chart.js/3.1.1/helpers.esm.min.js"></script>
   <script>
      var chrt = document.getElementById("chartId").getContext("2d");
      var chartId = new Chart(chrt, {
         type: 'bar',
         data: {
            labels: ["HTML", "CSS", "JAVASCRIPT", "CHART.JS", "JQUERY", "BOOTSTRP"],
            datasets: [{
               label: "online tutorial subjects",
               data: [20, 40, 30, 35, 30, 20],
               backgroundColor: ['coral', 'aqua', 'pink', 'lightgreen', 'lightblue', 'crimson'],
               borderColor: ['red', 'blue', 'fuchsia', 'green', 'navy', 'black'],
               borderWidth: 2,
            }],
         },
         options: {
            responsive: false,
            plugins: {
               tooltip: {
                  enabled: true,
                  usePointStyle: true,
                  titleAlign: 'center',
                  titleColor: 'gold',
                  titleSpacing: 3,
                  TitleFont: {
                     weight: 'bold'
                  },
                  backgroundColor: 'midnightblue',
                  bodyColor: 'orange',
                  bodyAlign: 'center',
                  bodyFont: {
                     weight: 'italic'
                  },
                  callbacks: {
                     labelPointStyle: function(context) {
                        return {
                           pointStyle: 'circle',
                           rotation: 0
                        };
                     },
                  }
               }
            }
         },
      });
   </script>
</body>
</html>
使用"编辑并运行"选项在线执行代码,然后将鼠标悬停在栏上并观察工具提示的样式。
输出
以下输出图表显示了各种工具提示配置 −