Plotly - 图例
默认情况下,具有多条轨迹的 Plotly 图表会自动显示图例。如果只有一条轨迹,则不会自动显示。要显示,请将 Layout 对象的 showlegend 参数设置为 True。
layout = go.Layoyt(showlegend = True)
图例的默认标签是轨迹对象名称。要设置图例标签,请明确设置轨迹的 name 属性。
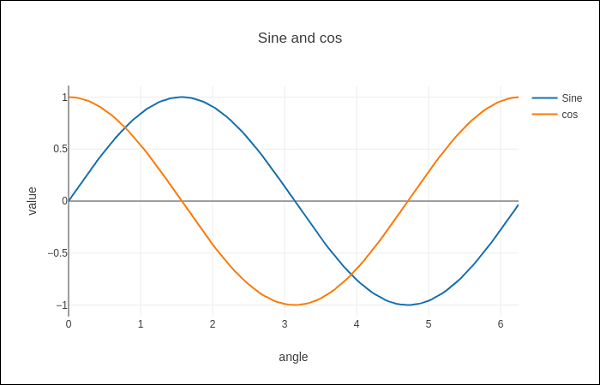
在以下示例中,绘制了两条具有 name 属性的散点轨迹。
import numpy as np
import math #needed for definition of pi

xpoints = np.arange(0, math.pi*2, 0.05)
y1 = np.sin(xpoints)
y2 = np.cos(xpoints)
trace0 = go.Scatter(
   x = xpoints,
   y = y1,
   name='Sine'
)
trace1 = go.Scatter(
   x = xpoints,
   y = y2,
   name = 'cos'
)
data = [trace0, trace1]
layout = go.Layout(title = "Sine and cos", xaxis = {'title':'angle'}, yaxis = {'title':'value'})
fig = go.Figure(data = data, layout = layout)
iplot(fig)
绘图如下所示−