Python - 伯努利分布
伯努利分布是二项分布的一个特例,其中进行一次实验,因此观察次数为 1。因此,伯努利分布描述的事件恰好有两个结果。
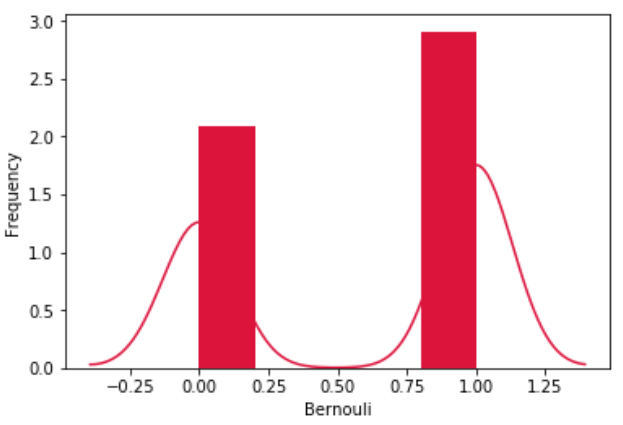
我们使用 numpy 库中的各种函数以数学方式计算伯努利分布的值。创建直方图,并在其上绘制概率分布曲线。
from scipy.stats import bernoulli
import seaborn as sb

data_bern = bernoulli.rvs(size=1000,p=0.6)
ax = sb.distplot(data_bern,
                  kde=True,
                  color='crimson',
                  hist_kws={"linewidth": 25,'alpha':1})
ax.set(xlabel='Bernouli', ylabel='Frequency')
其输出如下 −