
Python - 图表属性
Python 拥有出色的数据可视化库。Pandas、numpy 和 matplotlib 的组合可以帮助创建几乎所有类型的可视化图表。在本章中,我们将从查看一些简单图表及其各种属性开始。
创建图表
我们使用 numpy 库创建创建图表所需的映射数字,并使用 matplotlib 中的 pyplot 方法绘制实际图表。
import numpy as np
import matplotlib.pyplot as plt

x = np.arange(0,10)
y = x ^ 2
#Simple Plot
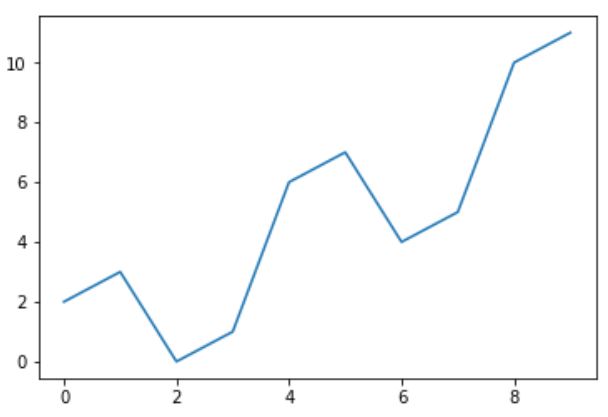
plt.plot(x,y)
其输出如下 −
标记轴
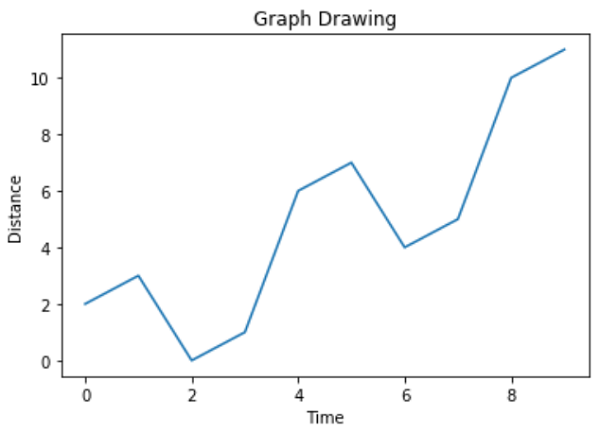
我们可以使用库中的适当方法将标签应用于轴以及图表的标题,如下所示。
import numpy as np
import matplotlib.pyplot as plt

x = np.arange(0,10)
y = x ^ 2
#标记轴和标题
plt.title("Graph Drawing")
plt.xlabel("Time")
plt.ylabel("Distance")
#简单绘图
plt.plot(x,y)
其输出如下 −
格式化线条类型和颜色
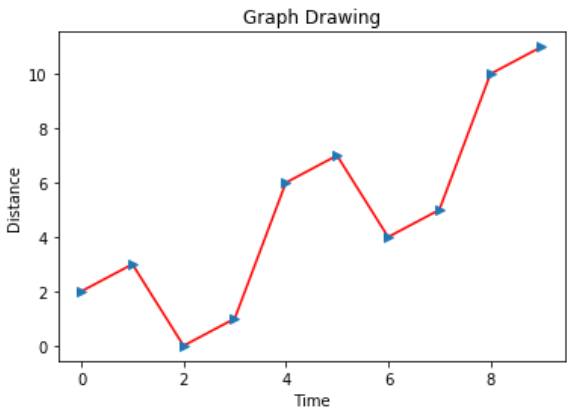
可以使用库中的适当方法指定图表中线条的样式和颜色,如下所示。
import numpy as np
import matplotlib.pyplot as plt

x = np.arange(0,10)
y = x ^ 2
#Labeling the Axes and Title
plt.title("Graph Drawing")
plt.xlabel("Time")
plt.ylabel("Distance")

# Formatting the line colors
plt.plot(x,y,'r')

# Formatting the line type
plt.plot(x,y,'>')
其输出如下 −
保存图表文件
可以使用库中的适当方法将图表保存为不同的图像文件格式,如下所示。
import numpy as np
import matplotlib.pyplot as plt

x = np.arange(0,10)
y = x ^ 2
#标记轴和标题
plt.title("Graph Drawing")
plt.xlabel("Time")
plt.ylabel("Distance")

#格式化线条颜色
plt.plot(x,y,'r')

#格式化线条类型
plt.plot(x,y,'>')

#保存为 pdf 格式
plt.savefig('timevsdist.pdf', format='pdf')
上述代码在 python 的默认路径中创建 pdf 文件环境。

