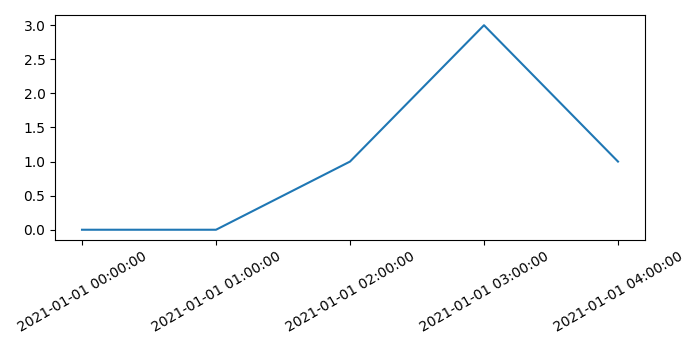
使用 Matplotlib 在轴标签中创建带有日期和时间的图表
matplotlibserver side programmingprogramming更新于 2025/11/13 19:17:00
要创建在轴标签中带有日期和时间的图表,我们可以采取以下步骤−
- 创建一个图形并添加一组子图。
- 使用 numpy 创建 x 和 y 数据点。
- 设置 X 轴的日期格式化程序。
- 使用 plot() 方法绘制 x 和 y。
- 设置 X 轴的刻度。
- 设置 X 轴的日期时间刻度标签,并进行一些旋转。
- 使用 plt.tight_layout() 方法使绘图布局紧凑。
- 要显示图形,请使用 show() 方法。
示例
from matplotlib import pyplot as plt, dates
import datetime
import numpy as np
plt.rcParams["figure.figsize"] = [7.00, 3.50]
plt.rcParams["figure.autolayout"] = True
fig, ax = plt.subplots()
x = np.array([datetime.datetime(2021, 1, 1, i, 0) for i in range(5)])
y = np.random.randint(5, size=x.shape)
ax.xaxis.set_major_formatter(dates.DateFormatter('%m-%d %H:%M'))
plt.plot(x, y)
ax.set_xticks(x)
ax.set_xticklabels(x, rotation=30, fontdict={'horizontalalignment': 'center'})
plt.show()
输出