相当于 Matplotlib 中 matlab 的 imagesc
matplotlibserver side programmingprogramming更新于 2025/11/13 18:56:00
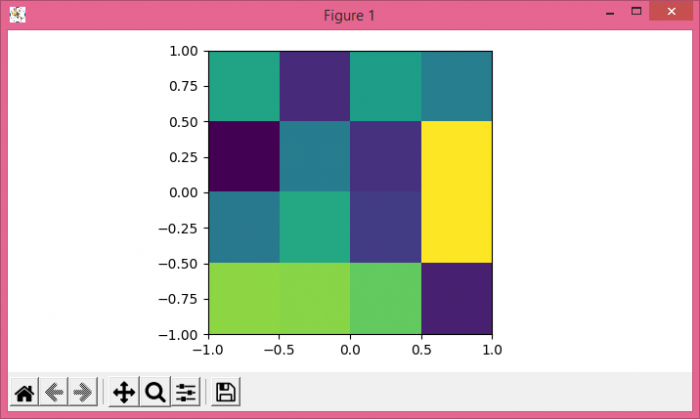
要制作等效的 imagesc,我们可以使用范围 [left, right, bottom, top]。
步骤
- 使用 numpy 创建随机数据。
- 将数据显示为图像,即在 2D 常规栅格上,使用数据和范围 [−1, 1, −1, 1] 参数。
- 要显示图形,请使用 show() 方法。
示例
import numpy as np
from matplotlib import pyplot as plt
plt.rcParams["figure.figsize"] = [7.00, 3.50]
plt.rcParams["figure.autolayout"] = True
data = np.random.rand(4, 4)
plt.imshow(data, extent=[-1, 1, -1, 1])
plt.show()
输出