
在 Matplotlib 中将小图嵌入子图内
matplotlibserver side programmingprogramming更新于 2025/11/17 3:19:00
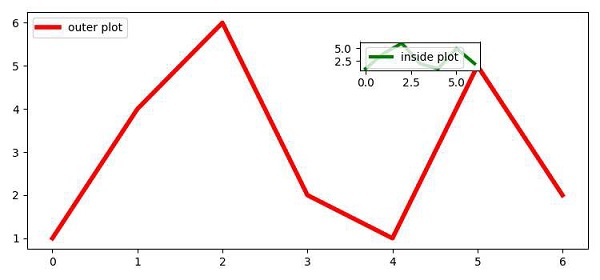
要将小图嵌入子图内,我们可以采取以下步骤 −
使用 subplots() 方法,创建一个图形和一组子图 (fig, ax1)。
在 ax1 上,绘制一条线,颜色为红色,线宽 = 4,标签 =”外图”。
使用 add_axes() 添加一个轴,即 ax2,其值为 l、b、h 和 w。
使用plot() 方法,颜色为绿色,线宽 = 3,标签 ="inside plot"。
使用 legend() 方法在两个图上设置图例。
要显示图形,请使用 show() 方法。
示例
from matplotlib import pyplot as plt
plt.rcParams["figure.figsize"] = [7.50, 3.50]
plt.rcParams["figure.autolayout"] = True
fig, ax1 = plt.subplots()
ax1.plot([1, 4, 6, 2, 1, 5, 2], c="red", lw=4, label="outer plot")
l, b, h, w = .6, .75, .1, .2
ax2 = fig.add_axes([l, b, w, h])
ax2.plot([1, 4, 6, 2, 1, 5, 2], color='green', lw=3, label="inside plot")
ax1.legend(loc='upper left')
ax2.legend(loc='upper left')
plt.show()
输出
相关文章
打印
下一节:如何在 IPython 笔记本中隐藏 <matplotlib.lines.Line2D>? ❯❮ 上一节:如何使用 Matplotlib 中的 Seaborn factorplot 更改图形大小?

