如何在 Matplotlib 中在绘图上创建自定义标记
machine learningserver side programmingprogrammingmatplotlib更新于 2025/5/21 7:52:17
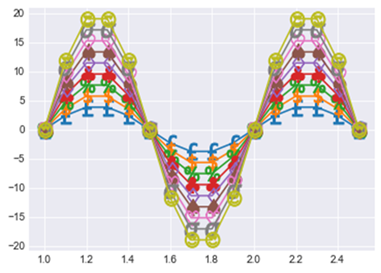
要在绘图或图形上创建自定义标记,我们使用一个列表,在其中写入我们想要在绘图中看到的标记。标记只不过是符号、表情符号、字符或我们想要在图形上看到的任何字符。
为了创建标记,我们首先将导入所需的库。
import matplotlib.pyplot as plt
import numpy as np
现在,我们将在正弦曲线上创建一个标记。让我们创建大小为 (12,6) 的网格,
x = np.arange(1, 2.6, 0.1)
y = np.sin(2 * np.pi * x)
plt.subplots(figsize=(12,6))
在这里我们将创建自定义标记列表,
custom_markers = ['$'+x+'$' for x in
   ['£','\$','\%','\clubsuit','\diamondsuit','\spadesuit','\heartsuit','\sigma','😍" />']]
现在让我们绘制正弦曲线,
for i,marker in enumerate(custom_markers):
   plt.plot(x, 2*(i+2)*y, marker=marker, markersize=15)
显示图形,
plt.show()
输出