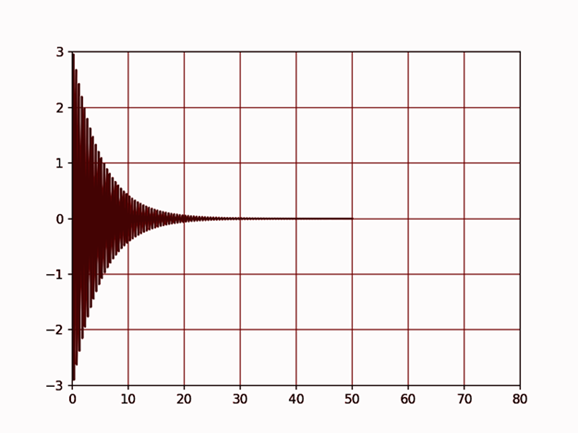
如何在 Matplotlib 中使用 FuncAnimation 绘制指数衰减函数
machine learningserver side programmingprogrammingmatplotlib更新于 2025/7/10 23:22:17
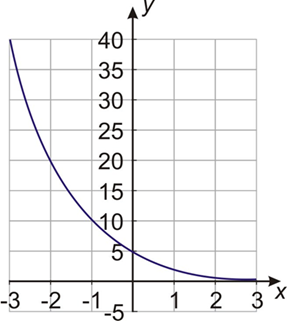
假设我们要为一个指数衰减的函数绘制动画,例如 y = a(b)^x,其中 b = 增长因子,a = 初始值。
一个指数衰减函数如下所示:
不过,目前我们想要为指数衰减的 tan 函数绘制动画。
首先导入库,
import numpy as np
import matplotlib.pyplot as plt
from matplotlib.animation import FuncAnimation
定义坐标区
fig, a = plt.subplots()
绘制带坐标区的空白图形
xdata, ydata = [], []
line, = ax.plot(xdata, ydata)
设置网格边界
ax.set_xlim(0, 10)
ax.set_ylim(-3.0, 3.0)
ax.grid()
定义函数来生成用于代替帧数的数据,
def frame_generator(i=0):
   while i < 50:
      i += 0.1
      yield x, np.tan(2*np.pi*x) * np.exp(-x/5.)
定义函数来绘制动画,
def animate(data):
   x, y = data
   xdata.append(x)
   ydata.append(y)
  xmin, xmax = ax.get_xlim()
if x >= xmax:
ax.set_xlim(xmin, 2*xmax)
ax.figure.canvas.draw()
line.set_data(xdata, ydata)
return line
激活动画
ani = FuncAnimation(fig, animate, frame_gen, blit=True, interval=2, repeat=False)
绘制图形
plt.show()
输出