
如何使用 Python 可视化 API 结果
简介..
编写 API 的最大优势之一是提取当前/实时数据,即使数据快速变化,API 也始终会获取最新数据。API 程序将使用非常具体的 URL 来请求某些信息,例如 Spotify 或 Youtube Music 中 2020 年播放次数最多的 100 首歌曲。请求的数据将以易于处理的格式返回,例如 JSON 或 CSV。
Python 允许用户将 API 调用写入几乎任何您能想到的 URL。在这个例子中,我将展示如何从 GitHub 中提取 API 结果并将它们可视化。
注意 - 计划是展示来自 Spotify 的 API 结果,但 Spotify 需要更多先决条件,这可能需要超过 1 篇文章,因此我们将在本篇文章中坚持使用 GitHUb。
Github,通常称为开发人员 Facebook,允许我们编写 API 调用来提取各种各样的数据。假设您想搜索带有更多星星的 Javascript Github 存储库。GitHub 不需要 API 密钥,而其他人可能需要。
怎么做..
1. 通过打开 python 命令提示符并触发 pip install request 来安装请求包。
import request

# 设置站点网址
site_url = 'https://api.github.com/search/repositories?q=language:javascript&sort=stars'

# 设置标头
headers = {'Accept': 'application/vnd.github.v3+json'}

# 调用网址并保存响应
response = request.get(site_url, headers=headers)

# 获取响应
print(f"Output \n *** Response from {site_url} is {response.status_code} ")
输出
*** Response from https://api.github.com/search/repositories?q=language:javascript&sort=stars is 200
2.该API返回的信息是JSON格式的,所以我们需要使用json()方法将信息转换为Python字典。
示例
response_json = response.json()
print(f"Output \n *** keys in the Json file \n {response_json.keys()} \n")

print(f" *** Total javascript repositories in GitHub \n {response_json['total_count']}" )
输出
*** keys in the Json file
dict_keys(['total_count', 'incomplete_results', 'items'])

*** Total javascript repositories in GitHub
11199577
因此,我们有 3 个键可以忽略其中的 incomplete_results。现在让我们检查一下我们的第一个存储库。
示例
repositories = response_json['items']
first_repo = repositories[0]

print(f"Output \n *** Repository information keys total - {len(first_repo)} - values are -\n")
for keys in sorted(first_repo.keys()):
print(keys)

print(f" *** Repository name - {first_repo['name']}, Owner - {first_repo['owner']['login']}, total watchers - {first_repo['watchers_count']} ")
输出
*** Repository information keys total - 74 - values are -

archive_url
archived
assignees_url
blobs_url
branches_url
clone_url
collaborators_url
comments_url
commits_url
compare_url
contents_url
contributors_url
created_at
default_branch
deployments_url
description
disabled
downloads_url
events_url
fork
forks
forks_count
forks_url
full_name
git_commits_url
git_refs_url
git_tags_url
git_url
has_downloads
has_issues
has_pages
has_projects
has_wiki
homepage
hooks_url
html_url
id
issue_comment_url
issue_events_url
issues_url
keys_url
labels_url
language
languages_url
license
merges_url
milestones_url
mirror_url
name
node_id
notifications_url
open_issues
open_issues_count
owner
private
pulls_url
pushed_at
releases_url
score
size
ssh_url
stargazers_count
stargazers_url
statuses_url
subscribers_url
subscription_url
svn_url
tags_url
teams_url
trees_url
updated_at
url
watchers
watchers_count
*** Repository name - freeCodeCamp, Owner - freeCodeCamp, total watchers - 316079
4. 可视化的时间到了,有很多信息需要消化,所以最好的方法是将结果可视化。记住 - "一张图片胜过千言万语"。
我已经在其他文章中介绍了 matplotlib,因此我们将使用 plotly 绘制图表。
安装模块 - plotly。我们将从导入 plotly 开始。
示例
from plotly.graph_objs import Bar
from plotly import offline
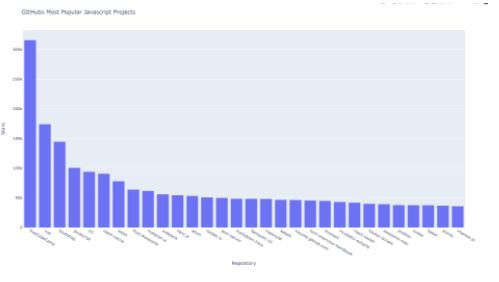
6.我们将制作一个包含存储库与星号数量的条形图。星号越多,存储库越受欢迎。这是一个查看谁排在首位的好方法。因此,我们需要两个变量存储库名称和星号数量。
In[6]:
示例
repo_names, repo_stars = [], []
for repo_info in repositories:
repo_names.append(repo_info['name'])
repo_stars.append(repo_info['stargazers_count'])
7.通过准备数据列表开始可视化。它包含一个字典,定义绘图类型并提供 x 值和 y 值的数据。您可能已经猜到了,是的,我们将使用 x 轴绘制项目名称,使用 y 轴绘制星形。
示例
data_plots = [{'type' : 'bar', 'x':repo_names , 'y': repo_stars}]
8.我们将添加 x 轴、y 轴以及整个图表的标题。
示例
layout = {'title': 'GItHubs Most Popular Javascript Projects',
'xaxis': {'title': 'Repository'},
'yaxis': {'title': 'Stars'}}
9. 绘图时间。
import requests
from plotly.graph_objs import Bar
from plotly import offline

site_url = 'https://api.github.com/search/repositories?q=language:javascript&sort=stars'

headers = {'Accept': 'application/vnd.github.v3+json'}
response = requests.get(site_url, headers=headers)
response_json = response.json()

repo_names, repo_stars = [], []
for repo_info in repositories:
repo_names.append(repo_info['name'])
repo_stars.append(repo_info['stargazers_count'])

data_plots = [{'type' : 'bar', 'x':repo_names , 'y': repo_stars}]
layout = {'title': 'GItHubs Most Popular Javascript Projects',
'xaxis': {'title': 'Repository'},
'yaxis': {'title': 'Stars'}}

fig = {'data': data_plots, 'layout': layout}
offline.plot(fig, filename='Most_Popular_JavaScript_Repos.html')
示例
'Most_Popular_JavaScript_Repos.html'
输出
Most_Popular_JavaScript_Repos.html 将在与以下输出的代码相同的目录中创建。
相关文章
有用资源
python 参考教程 - 该教程包含有关 python 的更多信息:https://www.cainiaomax.com/python/

