如何使用 Matplotlib 中的 Seaborn factorplot 更改图形大小?
matplotlibserver side programmingprogramming更新于 2025/5/5 22:22:17
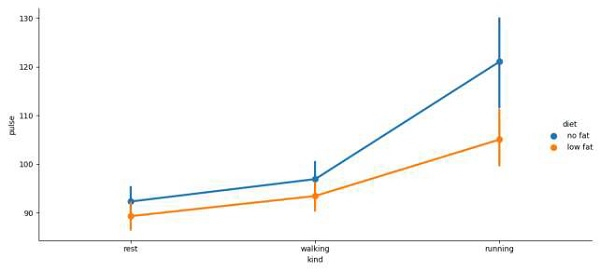
要使用 Seaborn factorplot 更改图形大小,我们可以采取以下步骤 −
使用 load_dataset() 方法加载锻炼数据。
使用 factorplot() 方法,通过自定义大小和纵横比值来更改图形大小。
要显示图形,请使用 show() 方法。
示例
import seaborn as sns
from matplotlib import pyplot as plt
plt.rcParams["figure.figsize"] = [7.50, 3.50]
plt.rcParams["figure.autolayout"] = True
exercise = sns.load_dataset("exercise")
sns.factorplot("kind", "pulse", "diet", exercise, kind="point", size=5, aspect=2)
plt.show()
输出