如何在 Matplotlib 中单独显示图形?
matplotlibserver side programmingprogramming更新于 2025/5/5 23:37:17
要在 matplotlib 中显示多个图形,我们可以采取以下步骤 −
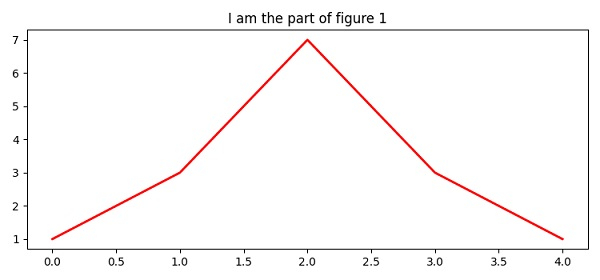
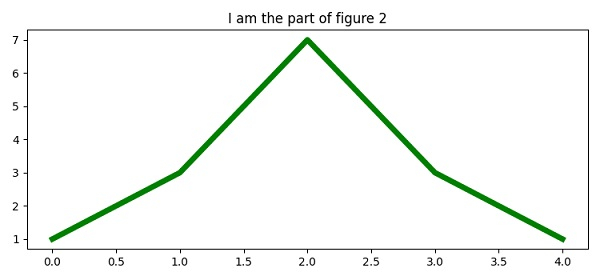
要创建新图形或激活现有图形,请使用 figure() 方法。(创建两个图形,即 Figure1 和 Figure2)。
使用相同的列表绘制线条(颜色为红色和绿色,线宽为 2 和 5)。
在两个图形上设置绘图标题。
要显示图形,请使用 show() 方法。
示例
from matplotlib import pyplot as plt
plt.rcParams["figure.figsize"] = [7.50, 3.50]
plt.rcParams["figure.autolayout"] = True
fig1 = plt.figure("Figure 1")
plt.plot([1, 3, 7, 3, 1], c="red", lw=2)
plt.title("I am the part of figure 1")
fig2 = plt.figure("Figure 2")
plt.plot([1, 3, 7, 3, 1], c="green", lw=5)
plt.title("I am the part of figure 2")
plt.show()
输出