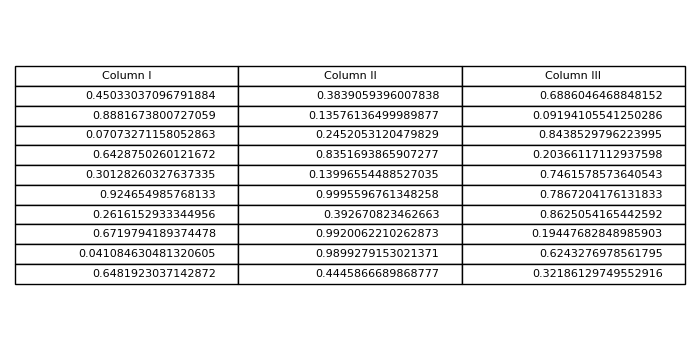
如何在 Matplotlib 中仅绘制表格?
matplotlibserver side programmingprogramming更新于 2025/4/30 18:52:17
要仅绘制表格,我们可以采取以下步骤−
- 使用子图创建 fig 和 axs。创建一个图形和一组子图。
- 为 10 行和 3 列创建随机数据。
- 为列名创建一个元组。
- axis('tight') − 设置限制,刚好足够大以显示所有数据,然后禁用进一步的自动缩放。
- axis('off') − 关闭轴线和标签。与 ''False'' 相同。
- 要在轴上添加表格,请使用 table() 实例,其中包含列文本、列标签、列和 location=center。
- 要显示图形,请使用 show() 方法。
示例
import numpy as np
from matplotlib import pyplot as plt
plt.rcParams["figure.figsize"] = [7.00, 3.50]
plt.rcParams["figure.autolayout"] = True
fig, axs = plt.subplots(1, 1)
data = np.random.random((10, 3))
columns = ("Column I", "Column II", "Column III")
axs.axis('tight')
axs.axis('off')
the_table = axs.table(cellText=data, colLabels=columns, loc='center')
plt.show()
输出