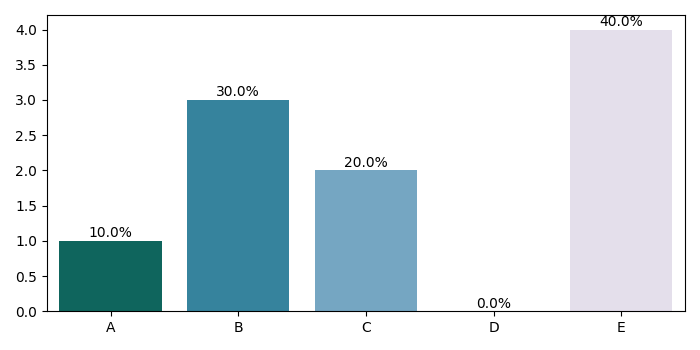
如何使用 Matplotlib 在 Seaborn 的条形图顶部添加百分比?
matplotlibserver side programmingprogramming更新于 2025/4/30 15:37:17
要在 Seaborn 的条形图顶部添加百分比,我们可以采取以下步骤 −
创建列表,x、y 和 百分比,以使用 Seaborn 进行绘制。
使用条形图,用条形图显示点估计和置信区间。存储返回的轴。
从返回的轴中查找补丁(在步骤 2 中)。
迭代补丁(在步骤 3 中返回)。
从补丁中查找 x 和 y ,以将百分比值放在条形图的顶部。
要显示图形,请使用 show() 方法。
示例
import matplotlib.pyplot as plt
import seaborn as sns
plt.rcParams["figure.figsize"] = [7.00, 3.50]
plt.rcParams["figure.autolayout"] = True
x = ['A', 'B', 'C', 'D', 'E']
y = [1, 3, 2, 0, 4]
percentage = [10, 30, 20, 0, 40]
ax = sns.barplot(x=x, y=y, palette='PuBuGn_r')
patches = ax.patches
for i in range(len(patches)):
   x = patches[i].get_x() + patches[i].get_width()/2
   y = patches[i].get_height()+.05
   ax.annotate('{:.1f}%'.format(percentage[i]), (x, y), ha='center')
plt.show()
输出