如何使用 Matplotlib 中的 GridSpec 类对齐网格中的多个图
machine learningserver side programmingprogrammingmatplotlib更新于 2025/5/21 6:22:17
对齐网格中的多个图可能非常混乱,并且会产生多个问题,例如更高的宽度和高度或对齐所有图的最小宽度。为了对齐网格中的所有图,我们使用 GridSpec 类。
假设我们有一个条形图,并且我们想要在此示例中对齐图的对称性。
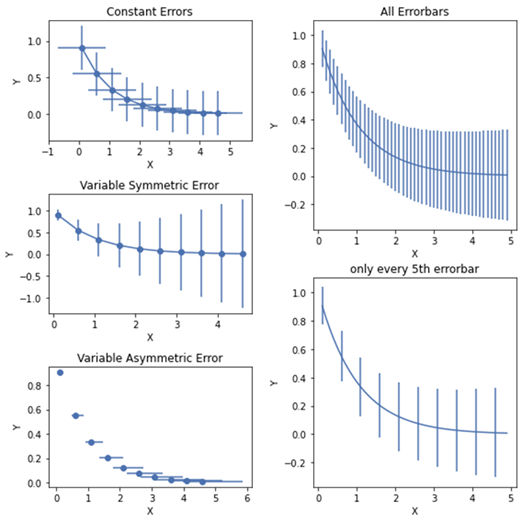
首先导入所有必要的库并在两个网格中绘制一些图形。然后,我们将在第一个网格上绘制一个常数误差线和一个对称和非对称误差线。在第二个网格中,我们将绘制样本误差线。
示例
import matplotlib.pyplot as plt
from matplotlib.gridspec import GridSpec

#定义图形大小和布局
fig = plt.figure(figsize=(8,8))
plt.style.use('seaborn-deep')

#定义绘制图形的函数
def plot_errorbar(axs, x, y, xerr=None, yerr=None, errevery=1,
   title=None, xlabel=None, ylabel=None, fmt=None):
      ax = fig.add_subplot(axs)
ax.errorbar(x, y, xerr=xerr, yerr=yerr, errorevery=errevery, fmt=fmt)
ax.set(title=title, xlabel=xlabel, ylabel=ylabel)

#第一个网格大小为 (3,1)
gs1 = GridSpec(3, 1)

#指数曲线的数据
x = np.arange(0.1, 5, 0.5)
y = np.exp(-x)

#绘制 x 和 y 轴为常数的误差线
plot_errorbar(gs1[0], x, y, xerr=0.8, yerr=0.3, title='Constant
   Errors', xlabel='X', ylabel='Y', fmt='-o')
#将变化误差定义为 x 的函数
error = 0.1 + 0.25 * x
plot_errorbar(gs1[1], x, y, yerr=error, title='Variable Symmetric
   Error', xlabel='X', ylabel='Y', fmt='-o')

#定义有界和无界误差
lower_error = 0.5 * error
upper_error = error
asymmetric_error = [lower_error, upper_error]
plot_errorbar(gs1[2], x, y, xerr=asymmetric_error, title='Variable
   Asymmetric Error', xlabel='X', ylabel='Y', fmt='o')

#使用与网格 1 相同的步骤绘制网格 2
gs1.tight_layout(fig, rect=[0, 0, 0.5, 1])

#为指数曲线定义具有较小间隔的数据
x = np.arange(0.1, 5, 0.1)
y = np.exp(-x)
gs2 = GridSpec(2, 1)
'yerr = 0.1 + 0.1 * np.sqrt(x)
plot_errorbar(gs2[0], x, y, yerr=yerr, title='All Errorbars', xlabel='X', ylabel='Y', fmt='-')
plot_errorbar(gs2[1], x, y, yerr=yerr, errevery=5, title='5th errorbar', xlabel='X', ylabel='Y', fmt='-')
gs2.tight_layout(fig, rect=[0.5, 0, 1, 1], h_pad=0.5)
top = min(gs1.top, gs2.top)
bottom = max(gs1.bottom, gs2.bottom)
gs1.update(top=top, bottom=bottom)
gs2.update(top=top, bottom=bottom)

#显示图表
plt.show()
输出